






Skip to the main content.

WEBSITE GROWTH & CONVERSION

Web Design & Development


SEO & AEO


Conversion Rate Optimization


Lead Generation Strategies


HUBSPOT SUPPORT & ENABLEMENT

HubDesk


HubSpot Training


HubSpot Change Management

FREE TOOLS & ASSESSMENTS

AEO Auditor


HubSpot Al Readiness Scorecard


HubSpot Al Solutions Design


LEARN & WATCH

View All Resources


Ebooks & Templates


Webinars On-Demand


Expert Videos

10 min read

How to Automate Marketing Reporting | Tools, Steps, and Tips

How to Automate Marketing Reporting | Tools, Steps, and Tips

If your Monday starts with exporting numbers from five platforms into one spreadsheet, you already know how much time reporting takes. In a PHD survey of 1,721 senior brand marketers, more than 88% said they spend most of their time on reporting tasks, and time spent on reporting grew 57% over a decade. Automating marketing reporting gives that time back by connecting your data sources to a reporting tool that refreshes dashboards and delivers them on a schedule.

But automation only works when the reporting foundation is right. Accurate data, consistent KPI definitions, and reliable reporting rules determine whether an automated report is useful or misleading. The right setup also depends on what you need to automate, which reports matter most, and how your marketing stack handles data across platforms.

Getting that foundation in place can take more than simply connecting a few tools. Your CRM data may need to be structured, and external platforms connected before automation can work reliably. Campaign Creators, a HubSpot Elite Solutions Partner, helps teams build that foundation and turn it into dashboards and scheduled reports they can rely on.

Key Takeaways

  • Marketing reporting automation collects, standardizes, refreshes, and delivers reports on a schedule without manual exports.
  • Clean data and agreed KPI definitions come first, since automated reports repeat whatever errors they receive.
  • HubSpot builds, refreshes, and sends reports by email, Slack, or Google Chat, which covers many teams whose data already lives in the CRM.
  • AI can summarize reports, highlight important changes, and help teams quickly identify what deserves attention.

What Is Marketing Reporting Automation?

what-is-marketing-reporting-automation

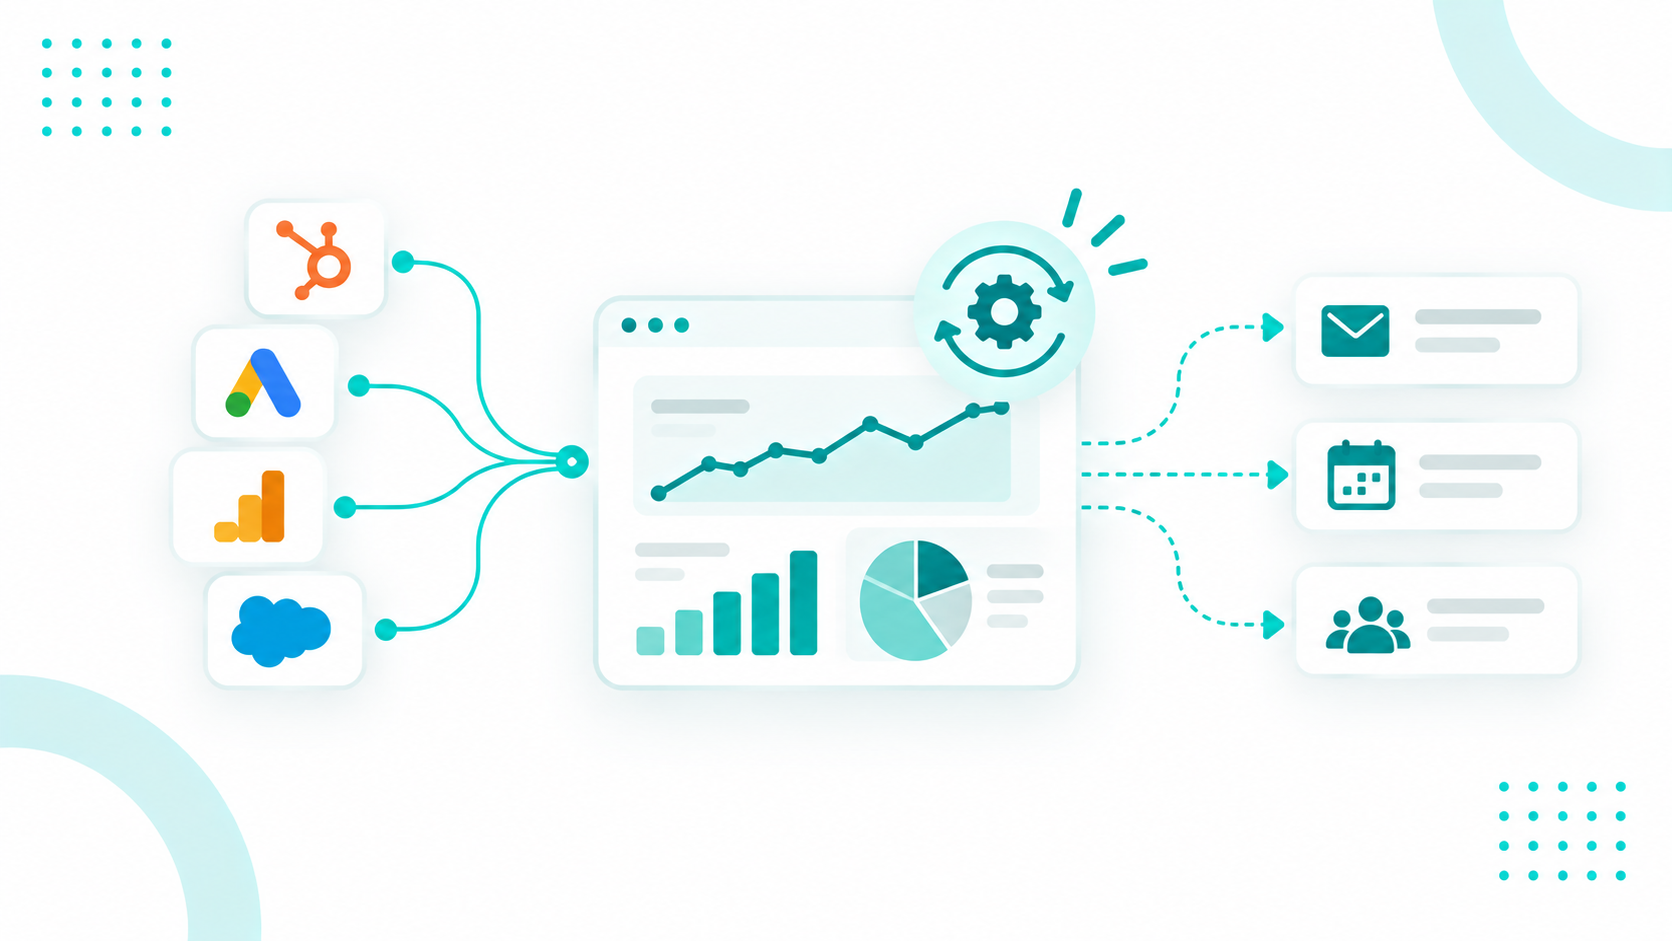
Marketing reporting automation is the process of collecting data from connected marketing platforms, standardizing it, turning it into reports, and delivering those reports to stakeholders on a schedule without manual exports or formatting. Once the rules are set, the reports update on their own as new data arrives.

A typical setup links your CRM, website analytics, ad platforms, and email tool to a reporting layer that applies the same filters and calculations every time. Say your team spends mornings pulling data from Google Analytics, Google Ads, and LinkedIn, merging it in a spreadsheet, building charts, and emailing leadership. With automation, those same data sources feed a single dashboard that refreshes automatically and delivers the latest report to leadership on a set schedule.

How Automation Differs From Dashboards

A dashboard is where people view metrics, trends, and performance data. Automation is what keeps that dashboard up to date by pulling in data, applying reporting rules, refreshing the numbers, and delivering the results to the right people. A dashboard can exist without automation, but someone still has to update the data and rebuild the report each time.

Worth a read: 6 Reasons You Should Be Using AI-Driven Marketing Automation

What Can You Automate in Marketing Reporting?

You can automate nearly every repeatable step between raw data and a delivered report.

  • Data collection. Connectors pull data from your CRM, analytics, ad, email, SEO, and ecommerce platforms, so no one has to remember which exports to run.
  • Standardization. The reporting layer maps fields across platforms, normalizes campaign names, and applies consistent date ranges and filters, so one tool's "form submission" and another's "lead" roll up to the same metric.
  • KPI calculations. Formulas like conversion rate (conversions/sessions), cost per lead (spend/leads), and ROAS (attributed revenue/ad spend) live in the data model and calculate the same way every time.
  • Report refreshes. Dashboards pull new data from connected sources on a set schedule, so the report framework stays in place while the numbers update.
  • Delivery. Finished reports go to specific people by email, Slack, or chat on a daily, weekly, or monthly schedule.
  • Alerts. Google Analytics spots unusual changes and trends automatically and can email you when a metric meets a condition you set, such as a sudden drop in conversions or a jump in cost per lead.

Each of these steps runs on fixed rules, which makes them safe to automate once the rules are right.

Which Marketing Reports Should You Automate First?

Automate the reports your team reviews on a set schedule, pulls from multiple sources, and rebuilds with the same calculations every time. Marketing performance, lead generation, and campaign reports are the usual starting points, and the others follow as your data matures.

Report

What It Tracks

Suggested Cadence

Marketing performance

Sessions, leads, qualified leads, conversion rates, pipeline, revenue, and channel contribution

Weekly, with a monthly deep dive

Lead generation

New contacts, MQLs, conversion rate, and leads by source, campaign, and form

Weekly

Campaign performance

Reach, engagement, conversions, pipeline, and revenue by campaign

Weekly while live, plus an end-of-campaign summary

Paid media and budget

Spend vs. budget, clicks, CTR, conversions, cost per conversion, ROAS, and projected month-end spend

Daily monitoring, weekly stakeholder report

Website and SEO

Traffic sources, landing-page conversions, organic clicks, impressions, CTR, average position, and top queries

Weekly monitoring, monthly analysis

Email marketing

Delivery rate, click-through rate, unsubscribes, conversions, and influenced pipeline

Weekly for active sends, monthly for nurture programs

Funnel and conversion

Volume and conversion rate at each stage, time between stages, and drop-off points

Weekly for operations, monthly for leadership

Attribution and revenue

Channels, campaigns, and touchpoints tied to deals and revenue

Monthly, with a quarterly executive review

Executive summary

Qualified demand, lead-to-opportunity rate, marketing-sourced pipeline, attributed revenue, CAC, and trends

Monthly

Paid media numbers from the last few days often look low because Google Ads records some conversions days after the click, so compare complete weeks. Organic search data swings week to week, which makes monthly views better for SEO strategy. In email reports, give clicks and conversions more weight than opens, since Apple Mail Privacy Protection preloads images and inflates open rates.

Which Tools Can Automate Marketing Reporting?

Native platforms like HubSpot report on the data already inside them. BI platforms like Power BI and Tableau model and combine data from across the business.

Tool

Best For

What It Automates

HubSpot

Teams whose marketing, sales, and CRM data already live in HubSpot

Custom reports, dashboards, recurring delivery to email, Slack, and Google Chat, attribution, and AI-generated report drafts

Data Studio (formerly Looker Studio)

Google-centric teams that want free, flexible dashboards

Native connectors for GA4, Google Ads, Search Console, BigQuery, and Sheets, calculated fields, and scheduled email delivery, with a 12-hour default refresh for Google marketing connectors

Microsoft Power BI

Organizations connecting marketing to sales, finance, or operations data

Scheduled data refresh, email subscriptions, and Copilot summaries in subscription emails (in preview)

Tableau

Enterprise analytics teams with advanced visualization needs

Subscriptions triggered by a schedule or an extract refresh, plus data-driven alerts by email or Slack


How These Tools Fit Together

A reporting platform can only show what the underlying data provides. Tracking, campaign names, CRM properties, and attribution rules all affect the numbers that appear in your reports. That is why a reliable reporting setup works in layers, with each layer contributing the data and rules needed to produce an accurate final view.

ChatGPT Image Sep 24, 2026, 07_41_02 PM

A small HubSpot-centered team may only need native HubSpot reports. As channels multiply, the next step is usually Data Studio for simple cross-channel views, then a data connector feeding Power BI or Tableau once the data gets complex.

How Do You Build an Automated Marketing Reporting Workflow?

Pick the one report that eats the most manual time, run it through these seven steps, and reuse the same pattern for the next report once it's stable.

1. Start With Business Questions

Every report should support a decision. Write down the questions it answers, such as "Are we generating enough qualified demand?" or "Which campaigns produce pipeline?" Then note who needs each answer and how often. Metrics that don't answer a listed question stay out of the report.

2. Map And Clean Every Data Source

List where each metric comes from and assign one source of truth per metric. Your CRM might own lifecycle stages and revenue, GA4 owns website behavior, ad platforms own spend, and Search Console owns organic search. Mapping this early exposes cases where two reports pull the same KPI from different places.

Audit the data before you connect anything. Look for duplicate records, missing campaign data or UTM parameters, broken conversion tracking, incorrect lifecycle stages, and inconsistent date fields. Poor data quality costs organizations an average of $12.9 million a year, and automation spreads those errors to every report it touches.

3. Standardize Metrics And Naming Conventions

Write one definition for every metric in your reports. Agree on what counts as a lead, MQL, SQL, and opportunity, and document the numerator, denominator, and time window for rates like conversion rate. Do the same for revenue attribution, including the model and lookback period.

Campaign names need the same treatment. A consistent format like FY26_Q3_Product_Webinar_US lets reports group and filter campaigns without manual cleanup. Shared definitions also build trust in the numbers.

4. Connect Sources And Build Core Reports

Link your platforms to the reporting layer. A simple setup can run entirely inside HubSpot, while a cross-channel setup might bring together data from HubSpot, GA4, Google Ads, and LinkedIn Ads through a connector and into a BI tool. HubSpot can also integrate with many of the channels you use for marketing.

Once your sources are connected, build only the reports tied to your step-one questions, starting with the priority reports above. We can help connect your platforms and set up the integrations so your reporting has the data it needs from the start.

5. Group Reports By Audience

Organize reports into dashboards for specific roles. Executives need pipeline, revenue, CAC, and marketing's contribution to the business. Marketing managers need campaigns, leads, conversion rates, and attribution. Channel owners need spend, clicks, conversions, and cost per acquisition.

6. Automate Refresh, Delivery, And Alerts

Set how often each data source refreshes, then schedule delivery by email, Slack, or chat so reports arrive as part of the team's routine. Add alerts for conditions that can't wait for the next report, such as spend passing a threshold or a sharp drop in lead volume. Automatic refresh isn't the same as real-time data, since each source has its own processing delay.

7. Validate Every Number Before Launch

Compare the automated numbers against each source platform before a report reaches leadership. Check that totals match, filters and date ranges behave correctly, time zones line up, attribution rules apply consistently, and every expected record appears. Repeat the check whenever you add an integration or change the reporting logic.


How Do You Automate Marketing Reporting in HubSpot?

HubSpot lets you automate marketing reporting by connecting your data, building reports, adding them to dashboards, and scheduling them for delivery. You can send reports by email, Slack, or Google Chat on a set schedule. Because contacts, campaigns, deals, and revenue are connected in HubSpot, your reports can also link marketing activity to pipeline and revenue without adding another reporting layer.

Create Custom Reports

Start with HubSpot's report library, which covers common questions out of the box. When a pre-built report falls short, create a custom one. Single-object reports analyze one object, such as contacts or deals, and update quickly because they query the live CRM. The custom report builder, available on Professional and Enterprise subscriptions, combines a primary data source with related objects, properties, activities, and calculated fields.

Plan Dashboards Around Refresh Timing

Save each report to a dashboard built for one audience, then use dashboard filters and visibility settings to control who sees what. HubSpot updates analytics data such as page views, form submissions, and email stats every 40 minutes, and custom report builder reports roughly every two hours. When you need the latest numbers, you can manually refresh a report or dashboard once every 15 minutes.

Schedule Recurring Delivery

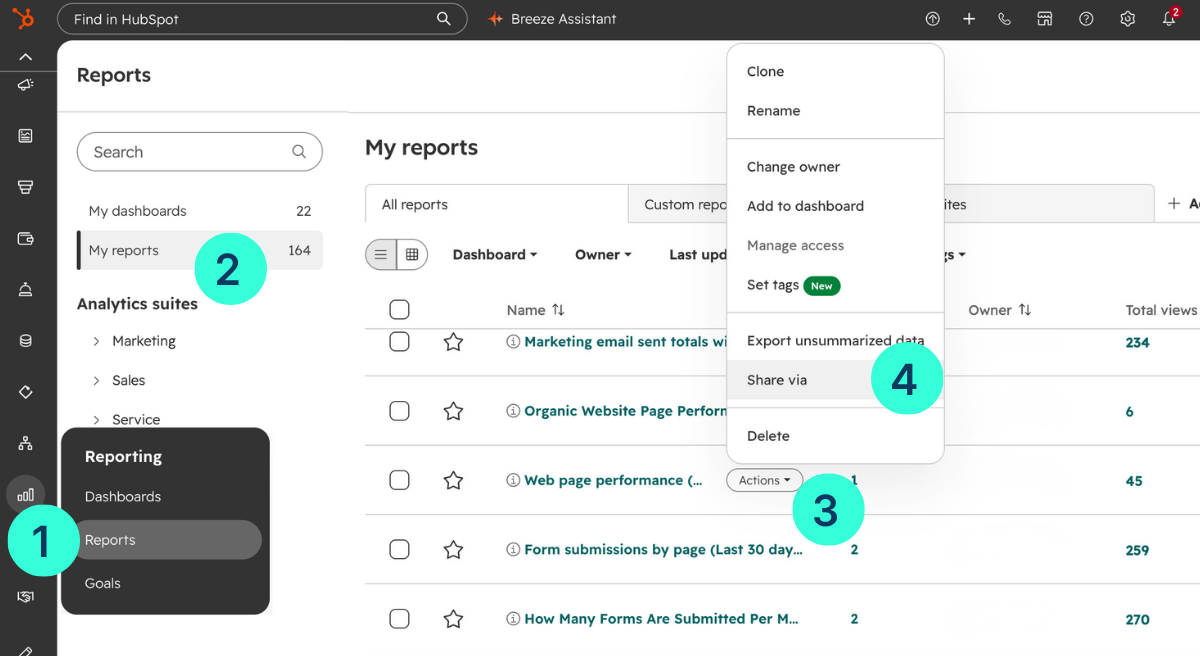
Go to Reporting > Reports, hover over a report, and click Actions > Share via to set up a recurring email on a daily, weekly, or monthly schedule.

schedule-recurring-reports-hubspot

A single report can have multiple schedules. Leadership can receive a weekly summary while channel owners receive reports on a different schedule. Each email can include the report itself or an attached CSV or Excel file. You can also send reports to people outside HubSpot when their email domain is verified.

You can schedule dashboard emails and recurring shares through Slack or Google Chat as well. Keep in mind that scheduled dashboard emails use data captured two hours before the send time, so schedule them with that delay in mind.

Connect Marketing To Revenue With Attribution

Attribution reports show which sources, assets, and interactions led to new contacts, deals, and revenue across multiple touchpoints. They move the reporting conversation from how many leads marketing generated to which activities contributed to pipeline. Check your tier before promising leadership a revenue view, since deal and revenue attribution require Marketing Hub Enterprise and contact attribution requires Marketing Hub or Content Hub Enterprise.

Use HubSpot AI To Draft And Summarize Reports

Type a question like "Which forms generated the most contacts last quarter?" and HubSpot's AI builds a single-object report template with suggested filters and a chart that you can edit before saving. The feature is available on Professional and Enterprise tiers of Marketing, Sales, Service, Data, and Content Hub.

Breeze Assistant can also summarize reports, campaigns, and CRM records and answer follow-up questions. Check any AI-built report against the underlying records before it goes on a leadership dashboard.

Interesting read: How to Design HubSpot Automation for Clean Data and Better AI

What Are the Best Practices for Marketing Reporting Automation?.

1. Match Cadence To How Fast You Can Act

Report on a metric only as often as someone can respond to it. Daily reports on slow-moving metrics like attribution create noise, and monthly reports on paid spend catch overspending too late. Anything urgent between scheduled reports belongs in an alert.

2. Document Sources, Definitions, And Formulas

Anyone on the team should be able to trace a number without asking the person who built the dashboard. Keep data sources, KPI definitions, formulas, filters, the attribution model, refresh timing, owners, distribution lists, and known limitations in one shared document.

3. Give Every Report An Owner

Assign one person to watch data quality, integration health, usage, and business relevance for each important report. A dashboard without an owner can keep running for months while its numbers drift out of date.

4. Prune Unused Reports Each Quarter

Automation makes it easy to pile up reports nobody reads. Each quarter, check if a report still supports a decision, if anyone opens it, and if another report already answers the same question. Then retire the ones that fail. A smaller set of reports is easier to maintain and easier to trust.

How Can AI Improve Automated Marketing Reporting?

AI adds an interpretation layer to automated marketing reporting. Instead of only delivering updated numbers, it can summarize what changed, highlight unusual movements, answer questions about the data, and help create reports from a written prompt.

Power BI can add a Copilot-generated summary to scheduled report emails, although this feature is still in preview. GA4 can surface unusual changes and emerging trends. Looker Studio includes Gemini features for conversational data analysis, while HubSpot can use AI to draft and summarize reports inside the CRM.

The biggest benefit can be in executive reporting. A summary can give leaders the context behind the numbers without requiring them to review every chart. For example:

Lead volume rose 9% over last month, led by paid search. Conversion rate dropped on the pricing page, and the decline is limited to one campaign that needs review.

The quality of that summary still depends on the quality of the data. Inconsistent campaign names, incomplete CRM fields, or broken tracking can lead AI to produce a clear explanation of inaccurate numbers. That makes a reliable reporting foundation essential.

Think of the full workflow as Collect → Clean → Calculate → Report → Summarize → Investigate → Act. Automation handles the first four stages. AI speeds up summarizing and investigating. Your team can then use those insights to decide what to do next.

Need Help Automating Your Marketing Reporting?

Automated reporting works when the CRM underneath it is clean, connected, and structured around the questions leadership asks.

Campaign Creators can review your HubSpot portal, fix the data and property structure, build the integrations that bring outside platforms in, and set up dashboards your team will trust.

Start with a complimentary HubSpot audit to see what your reporting setup needs.

Frequently Asked Questions

Do You Need A Data Warehouse To Automate Marketing Reporting?

No, native reporting tools and connectors cover many setups, and a warehouse like BigQuery or Snowflake becomes worth it once you need long-term history, very large datasets, or joins across many business systems.

Can Agencies Automate Reporting For Multiple Clients?

Yes, data connector tools can pull data from many client ad and analytics accounts into templated dashboards, so one report design can serve every client with its own filtered data.

Why Don't HubSpot And Google Analytics Numbers Match?

The two platforms count sessions, attribute conversions, handle time zones, and filter bots differently, so small gaps are normal, and your documentation should name one source of truth for each metric.

Do You Need Coding Skills To Automate Marketing Reporting?

No, HubSpot, Data Studio, and connector tools use visual builders, though complex Power BI or Tableau models go faster with someone who knows SQL or DAX.

How Long Does It Take To Set Up Automated Marketing Reporting?

A single dashboard on clean HubSpot data can be ready within days, while a cross-channel setup with connectors and a BI tool usually takes several weeks, largely because of data cleanup.

HubSpot Subscription Data Model: How to Structure Subscription Records for Reporting and Automation

HubSpot Subscription Data Model: How to Structure Subscription Records for Reporting and Automation

As more businesses adopt subscription-based revenue models, keeping subscription data organized becomes a bigger priority. Teams need accurate...
Read More
HubSpot Data Cleanup Strategy for Enterprise RevOps

HubSpot Data Cleanup Strategy for Enterprise RevOps

When your system holds conflicting information, each team works from a different version of reality. Marketing sees one story, sales sees another,...

Read More
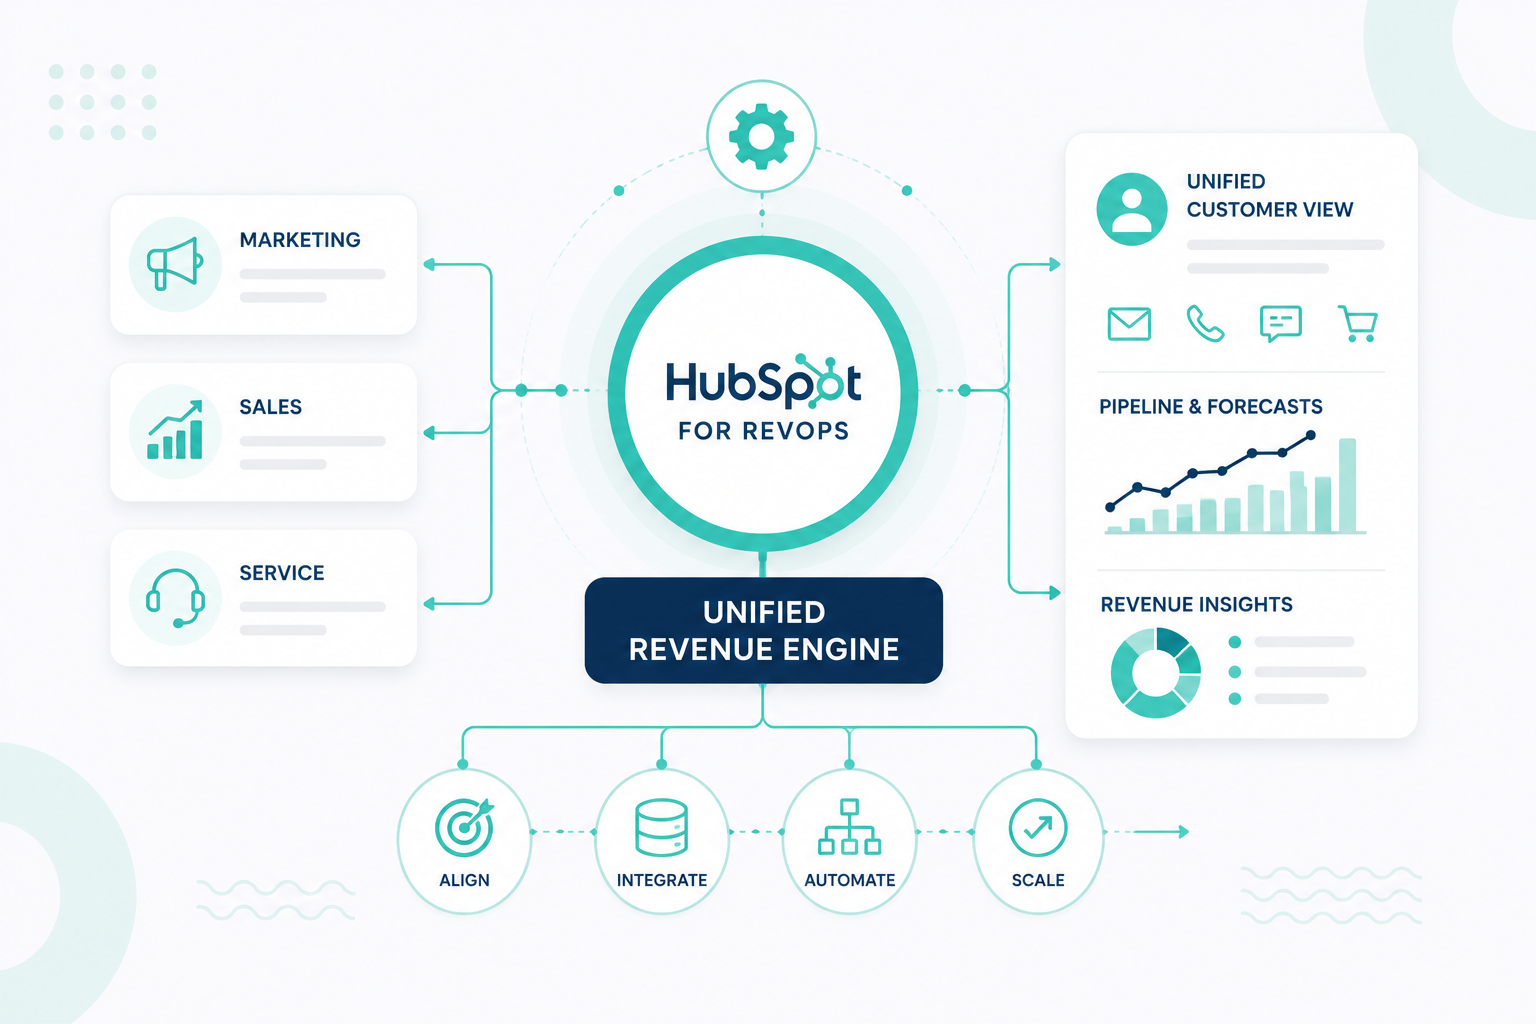
HubSpot for RevOps: How to Build a Unified Revenue Engine

HubSpot for RevOps: How to Build a Unified Revenue Engine

HubSpot can do much more than store contacts and track deals. When your customer data, teams, processes, automation, and reporting work together in...

Read More