






A HubSpot Elite Solutions Partner built to help organizations unify strategy, systems, and execution. We design HubSpot systems that scale.

See how we've solved complex HubSpot challenges across migrations, integrations, CMS, automation, and optimization.

Join a team building smarter HubSpot systems. We value strategic thinkers who move proactively, care about quality, and want to do meaningful work.

14 min read

How to Build a HubSpot Lead Scoring Framework for Enterprise RevOps

How to Build a HubSpot Lead Scoring Framework for Enterprise RevOps

Most enterprise HubSpot portals already have a lead score. Far fewer have a score that sales actually acts on. The usual reason is structural. A single number gets built from a handful of website activities, then quietly stops predicting anything useful once the business adds a second product, a third region, a fourth sales team, and 200,000 more contacts. Reps stop checking it. Marketing keeps reporting on it. Nobody can explain why a record scored 82.

A framework fixes the structure. It defines which signals get scored, which team the score serves, what action a threshold triggers, and how the model gets validated against the pipeline.

This guide covers how to build that framework inside HubSpot's current lead scoring tool, including the mechanics enterprise RevOps teams most often configure incorrectly.

Key Takeaways

  • A lead score is a calculated number while a framework defines what gets scored, who acts on it, and how the model is measured against revenue.
  • Legacy "HubSpot Score" properties stopped updating on August 31, 2025, so portals that were never rebuilt are running automation on frozen numbers.
  • Enterprise models need several scores, account-level signals, negative points, and decay, because one universal ranking cannot serve multiple ICPs and sales motions.

What Is a HubSpot Lead Scoring Framework?

professional-marketer-building-a-lead-scoring-model

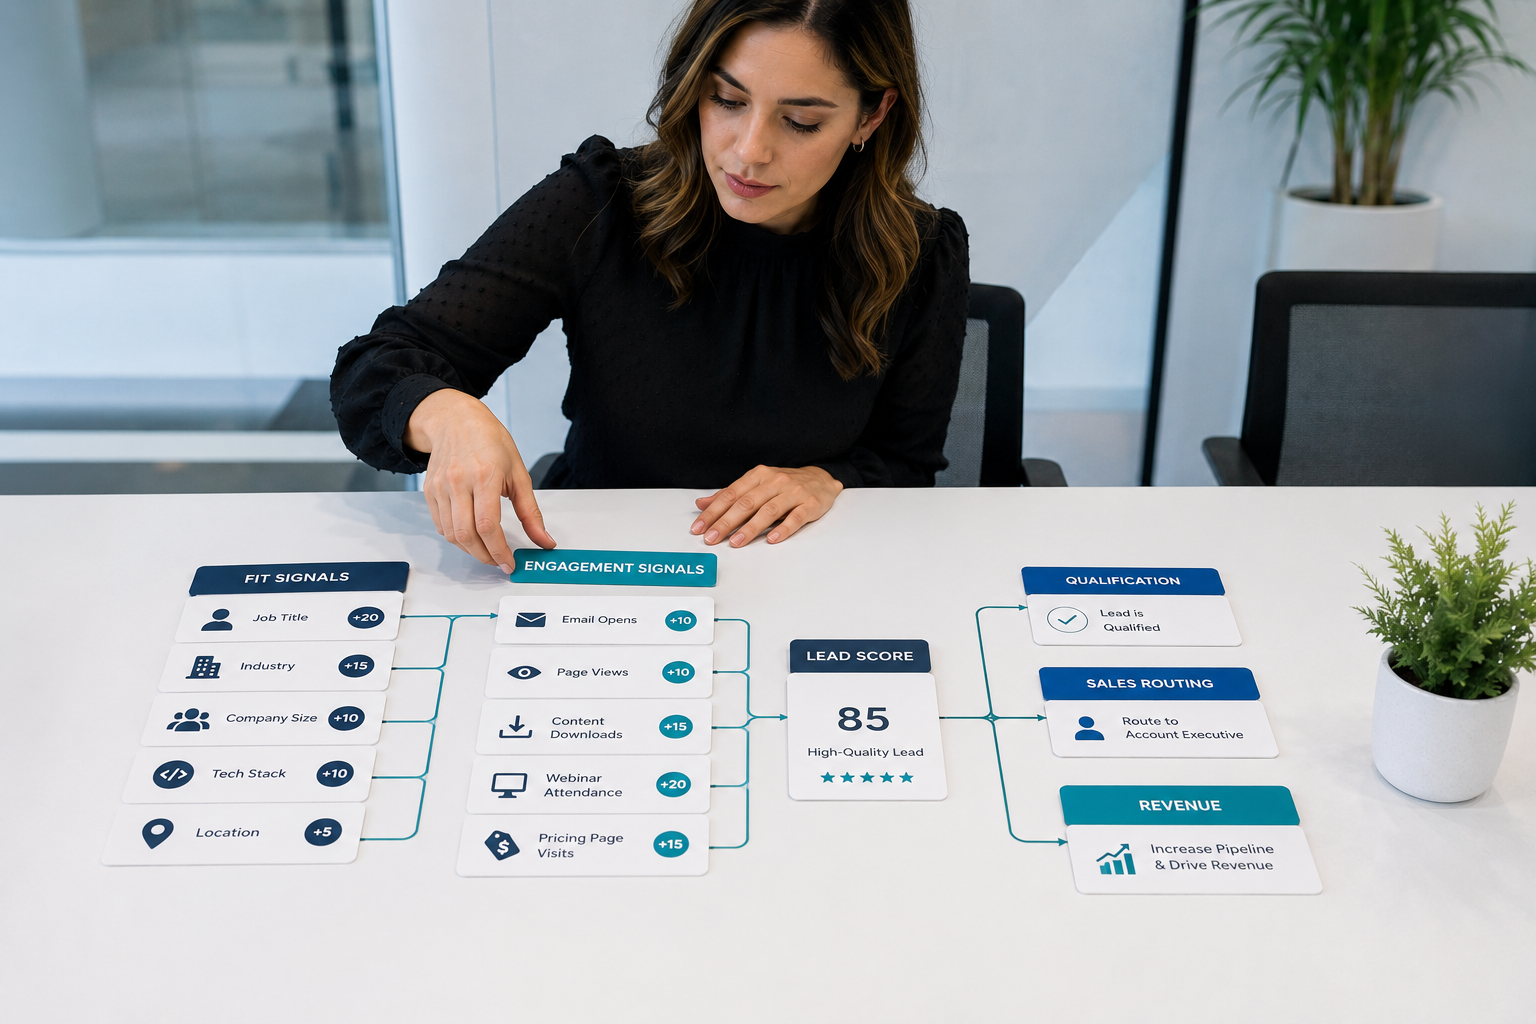
A HubSpot lead scoring framework is a documented system that assigns point values to contacts, companies, or deals based on characteristics and behaviors, then connects the resulting score to a specific qualification decision, a routing action, and a revenue metric.

The scoring tool itself handles the arithmetic. When you create a score, HubSpot evaluates records against your criteria and writes the result to a dedicated score property you can use in segments, views, workflows, and reports.

Three Score Types

HubSpot builds scores from two kinds of criteria: Property Values and Tracked Events.

  1. Fit scores evaluate who the prospect is, using property rules across job title, seniority, employee count, annual revenue, industry, region, and technology environment. Available for contacts and companies.
  2. Engagement scores evaluate what the prospect does, using event rules across website visits, form submissions, CTA clicks, marketing email interactions, meetings, and calls. Available for contacts and companies. For company scores, engagement is pulled from associated contact activity.
  3. Combined scores run both criteria types and create three properties: a total value, a fit-only value, and an engagement-only value. Available for contacts, companies, and deals. Deal scores are combined by default.

Contact scoring requires Marketing Hub Professional or Enterprise. Company scoring works with either Marketing Hub or Sales Hub. Deal scoring requires Sales Hub. AI-generated contact scores require Marketing Hub Enterprise.

Score Versus Framework

A score tells you

A framework defines

The current point value on a record

Which signals qualify for points, and why

That the value moved up or down

How much each signal is worth relative to the others

Which threshold band the record sits in

Which records enter the model and which are excluded

That a record crossed the qualification line

What happens operationally when that line is crossed

The fit and engagement components behind the total

Which team owns the next action on each combination

How the value has trended over the past six months

Which revenue metric proves the model is working

Nothing about its own accuracy

When the model gets reviewed, and who approves changes


Life After the Legacy Score Property

Any enterprise audit should start here. HubSpot announced the retirement of legacy scoring properties in February 2025 and phased it out: New legacy score properties were blocked on May 1, 2025, editing closed shortly after, and on August 31, 2025, existing legacy scores stopped updating entirely. Unused legacy properties have been periodically deleted since.

No migration happened automatically. Portals that were built on the old property before mid-2025 and never rebuilt now have frozen values steering live workflows, list membership, and reports. The downstream damage is quiet because a report showing a stale number still renders perfectly.

If you inherited a portal and are not certain which scoring era it runs on, check the lead scoring tool for active scores, then check any workflow or list that references a score property. That audit takes an afternoon and prevents a quarter of misrouted leads.


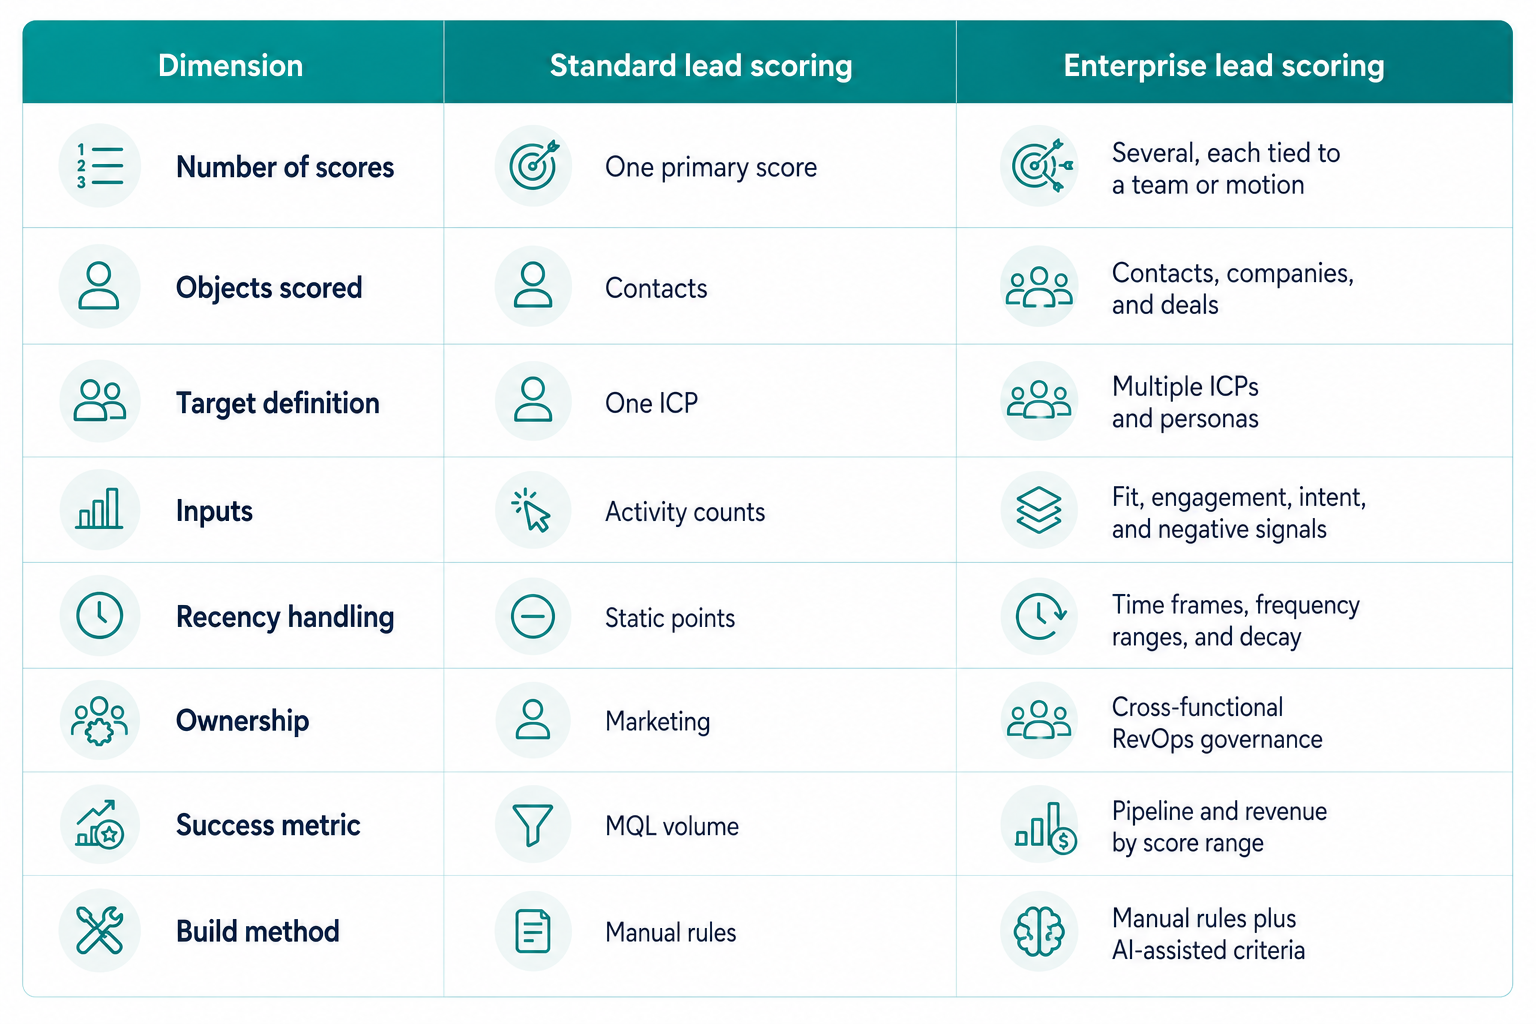
What Makes Enterprise Lead Scoring Different?

Enterprise lead scoring is different because the revenue process is rarely simple enough for one score, one buyer persona, and one qualification rule. The framework has to carry more variables without becoming something sales cannot interpret.

Multiple ICPs and Sales Motions

A technology company might sell to a CIO for one product, a VP of Marketing for another, and an operations leader for a third. Fit cannot be defined by a single universal profile when the profiles genuinely differ.

HubSpot supports multiple scores per object, so you can create separate scores for different products, regions, or teams. Each score should have a clear purpose, audience, and action. Five useful scores are better than twelve overlapping ones. Your subscription tier also determines how many scores you can create.

Committee Buying and Account Rollups

Enterprise purchases are group decisions. Gartner research puts the typical B2B buying group at six to ten stakeholders, each arriving with independently gathered information, and Forrester's report puts the average at 13, with 89% of purchase decisions crossing multiple departments.

Contact-level scoring alone misses that pattern. Five people from one account each showing moderate individual engagement can represent a stronger signal than any single contact's score suggests. Company scores solve this by aggregating associated contact activity, and HubSpot gives you four aggregation methods per rule: Sum, Average, Min, and Max. Summing webinar attendance across a buying group captures breadth. Averaging page views prevents one enthusiastic researcher from carrying the whole account.

Long Cycles and Recency

Most enterprise B2B purchases run six to 12 months from problem identification to signed contract, and complex platform decisions above $100,000 routinely run nine to 18 months. Records sit in the database for a long time, accumulating activity that no longer reflects current interest.

A report downloaded nine months ago should not carry the same weight as a pricing page visit from Tuesday. Time frames, frequency ranges, and decay exist to encode that difference.

Database Noise

Large portals contain employees, competitors, students, job seekers, partners, existing customers, and thousands of records with incomplete firmographics. A model that rewards every interaction will happily promote a competitor who downloads everything you publish.

Inclusion and exclusion segments, negative points, group limits, and per-event point caps are the controls that keep volume from masquerading as intent.

standard-lead-scoring-vs-enterprise-lead-scoring

Which Signals Should You Score?

Score the signals that change a revenue decision. If knowing something would not change what your team does with the record, it does not need points.

That test keeps models small enough to explain. HubSpot's own sales team learned this the hard way. Early internal models layered so many fit, behavioral, and intent variables that reps stopped trusting the output, and adoption only recovered after the model was simplified around high-impact conversion actions with proven close rates.

Fit: Firmographic and Demographic Data

Fit criteria establish membership in your target market. Common enterprise inputs include industry, employee count, annual revenue, region, job function, seniority, department, technology environment, business model, and customer status.

Two mechanics deserve attention here. Multiple criteria inside a single rule follow AND logic, so a rule combining "region is Northeast" and "employees greater than 50" fires only when both are true. And when a rule holds several values, Score Together adds points once for any match while Score Individually adds points for each match. Using Score Individually on a multi-select property is a common source of accidental fit inflation.

Engagement: Behavioral Activity

Engagement criteria measure interaction: page views, content downloads, form submissions, CTA clicks, marketing email opens and clicks, webinar registration and attendance, meetings booked and completed, and calls.

Weight these by business value, not availability. A blog visit and a completed sales meeting are not the same event with different labels. One practical caveat for enterprise portals: HubSpot's score calculation for call events only counts calls placed through HubSpot calling, so teams running an external dialler need to plan around that gap.

Intent: Conversion Actions

Some behaviors are direct expressions of commercial interest: demo requests, contact sales submissions, meeting bookings, pricing inquiries, proposal or quote requests, and consultation forms.

These deserve the heaviest weighting in most enterprise models, and they benefit from a per-rule point cap. HubSpot lets you switch a rule from "score every time" to a fixed limit, so five submissions of a one-point form contribute two points if that is the ceiling you set.

High-Impact Pages

Enterprise teams can move past assuming which pages matter. HubSpot's high-impact web page insights use AI to surface pages associated with conversions, showing each page's conversion rate and a confidence level based on conversion rate and traffic volume. You select the goal stages you care about, such as movement into a Lead lifecycle stage or a specific deal stage, and score visits to the pages that actually drove those transitions. Pages hosted outside HubSpot are included as long as the tracking code is installed.

One current limitation is worth checking before you build: High-impact page data is based on deal-to-company associations, so portals where deals are associated only to contacts will not see insights yet.

Negative Points

Subtract points for evidence that a record is not a viable opportunity such as unsupported region, non-target industry, company size below your ICP floor, competitor domain, student or job seeker signals, marketing unsubscribes, and sales disqualification.

A company can gain fit points for industry and size while losing points for sitting outside your service area. That combination is what keeps a well-scored record from being a poorly qualified one.

Account and Committee Breadth

For account-based motions, breadth of engagement is its own signal. Useful inputs include the number of engaged contacts, the number of engaged departments, executive-level participation, and multiple stakeholders attending sales meetings.

HubSpot's association settings support this by letting you filter which associated contacts feed a company or deal score, including by association label. Scoring only decision-maker-labelled contacts is a cleaner signal than scoring everyone who ever filled out a form.

Signal type

Examples

Role in the model

Fit

Industry, revenue, employee count, title, seniority, region

Qualifies who is worth pursuing

Engagement

Page views, downloads, email clicks, webinar attendance

Measures interest

Intent

Demo requests, pricing visits, meetings booked, high-impact pages

Flags active evaluation

Negative

Competitors, students, unsupported regions, unsubscribes

Protects the model from noise

Strong fit plus meaningful engagement plus a high-intent action is a priority record. High activity volume on its own is not.

How Do You Build the Framework in HubSpot?

Build the framework in ten steps, working from the business decision backward into the configuration. Lead scoring lives under Marketing > Lead Scoring, and edit permissions for Lead Scoring are required to create or change a score.

1. Define the Decision the Score Supports

Name the decision before opening the builder. Prioritizing sales-ready contacts, identifying high-fit accounts for an ABM motion, forecasting which open deals close this quarter, and finding expansion signals in the customer base are four different jobs that need four different scores.

This decision determines the object, the score type, and the population, so getting it explicit saves a rebuild later.

2. Pick the Object and Score Type

Match the object to the decision. Contact scores fit individual engagement and persona qualification. Company scores fit account-level qualification and ABM. Deal scores fit close-likelihood and forecasting.

Then choose fit, engagement, or combined. Combined scoring suits most enterprise use cases because it keeps the fit and engagement values visible as separate properties while producing one number for routing.

3. Set the Scoring Population

On the object tab, choose to score all records with exclusion segments applied, or score only specific records via inclusion segments.

Enterprise portals should almost always narrow the population. Excluding employees, competitors, partners, and existing customers from a new-business score keeps the distribution clean and makes threshold analysis meaningful.

4. Build Fit Criteria From Property Values

Add a property group, then build rules from the properties that define your ICP. You can score on the record's own properties or on associated record properties, which is how a contact score picks up the associated company's industry and employee count.

Segment membership is the escape hatch for complex logic. The scoring tool adds criteria additively and does not chain AND and OR conditions inside a single rule, so intricate qualification logic belongs in a segment that the score then references with Belongs To Any Of, All Of, or None Of.

5. Build Engagement Criteria From Events

Add an event group, select the event type, then filter by event property, time frame, and frequency. Frequency operators include Exactly, Between, At Least, and At Most, which support tiered rules such as two points for one to three email views and five points for four or more.

For company and deal scores, open Association settings to choose which associated contacts count and how their points aggregate. Sum captures total account activity, Average normalizes for account size, and Min or Max isolate the weakest or strongest individual signal.

6. Group Signals and Set Limits

Organize rules into groups that mirror how your funnel actually behaves, then cap each group.

group-signals-and-set-limits

Overall score limits are set via a dropdown with options ranging from -100 to 100, -200 to 200, -300 to 300, -400 to 400, -500 to 500, -1,000 to 1,000, and -10,000 to 10,000. A limit of 100 is the sensible default for most models, because a score people can reason about beats a score with more headroom. Group limits and criteria points both support decimals if you need finer weighting.

7. Subtract Points for Disqualifying Signals

Add the negative rules identified during signal selection. Every rule carries an add or subtract toggle, and a record's score goes negative when subtractions exceed additions.

If negative totals confuse your sales team, keep the disqualifiers in a group with a floor, or move hard disqualifications into an exclusion segment so those records never enter the model.

8. Turn On Decay Where Recency Matters

Decay is configured per event group with a percentage reduction and an interval of 1, 3, 6, or 12 months, where each month counts as 30 days. The logic is linear and applies to each event independently, so a 10-point form submission decaying 50% per month contributes five points after 30 days and zero after 60.

Decay also applies retroactively. A CTA click set to decay 100% over three months contributes nothing if it happened four months ago. Match the interval to your actual cycle length: aggressive decay suits a 30-day cycle, gentler decay suits a 12-month enterprise evaluation, and high-intent actions often deserve slower decay than routine engagement.

9. Set Thresholds That Map to Actions

Thresholds create a color-coded property that turns raw numbers into labels. Fit and engagement scores use High, Medium, and Low. Combined scores use a nine-cell grid where the letter carries fit from A to C and the number carries engagement from 1 to 3.

That grid is the most useful artifact in the tool for sales conversations, because it separates records a single number would blur together.

Fit

Engagement

Label

Action

High

High

A1

Route to sales immediately

High

Low

A3

Account development and nurture

Low

High

C1

Verify before routing, check for competitors and students

Low

Low

C3

Automated nurture or suppression


10. Test, Preview Distribution, and Turn It On

Before activation, use Test A Record on a deliberate sample: recent MQLs, recent SQLs, closed-won customers, closed-lost opportunities, a competitor, a high-engagement poor-fit contact, and an existing customer. Then run Preview Distribution to see how the model spreads across your database.

When a score is turned on, records are evaluated retroactively against current and historical values, then updated continuously. Editing a live score re-evaluates retroactively too, which is why the Used In tab on each score property matters: it shows every view, segment, workflow, and report that depends on that property before you change the math underneath them.


How Does the Score Drive RevOps Decisions?

A score drives decisions when it changes what happens next. Score properties work inside segments, saved views, workflows, reports, and record filters, which is what turns a number into an operating process.

One Definition of Qualified

Marketing and sales often disagree about lead quality because they are measuring different things. Marketing sees engagement depth. Sales sees company size, role relevance, and buying needs.

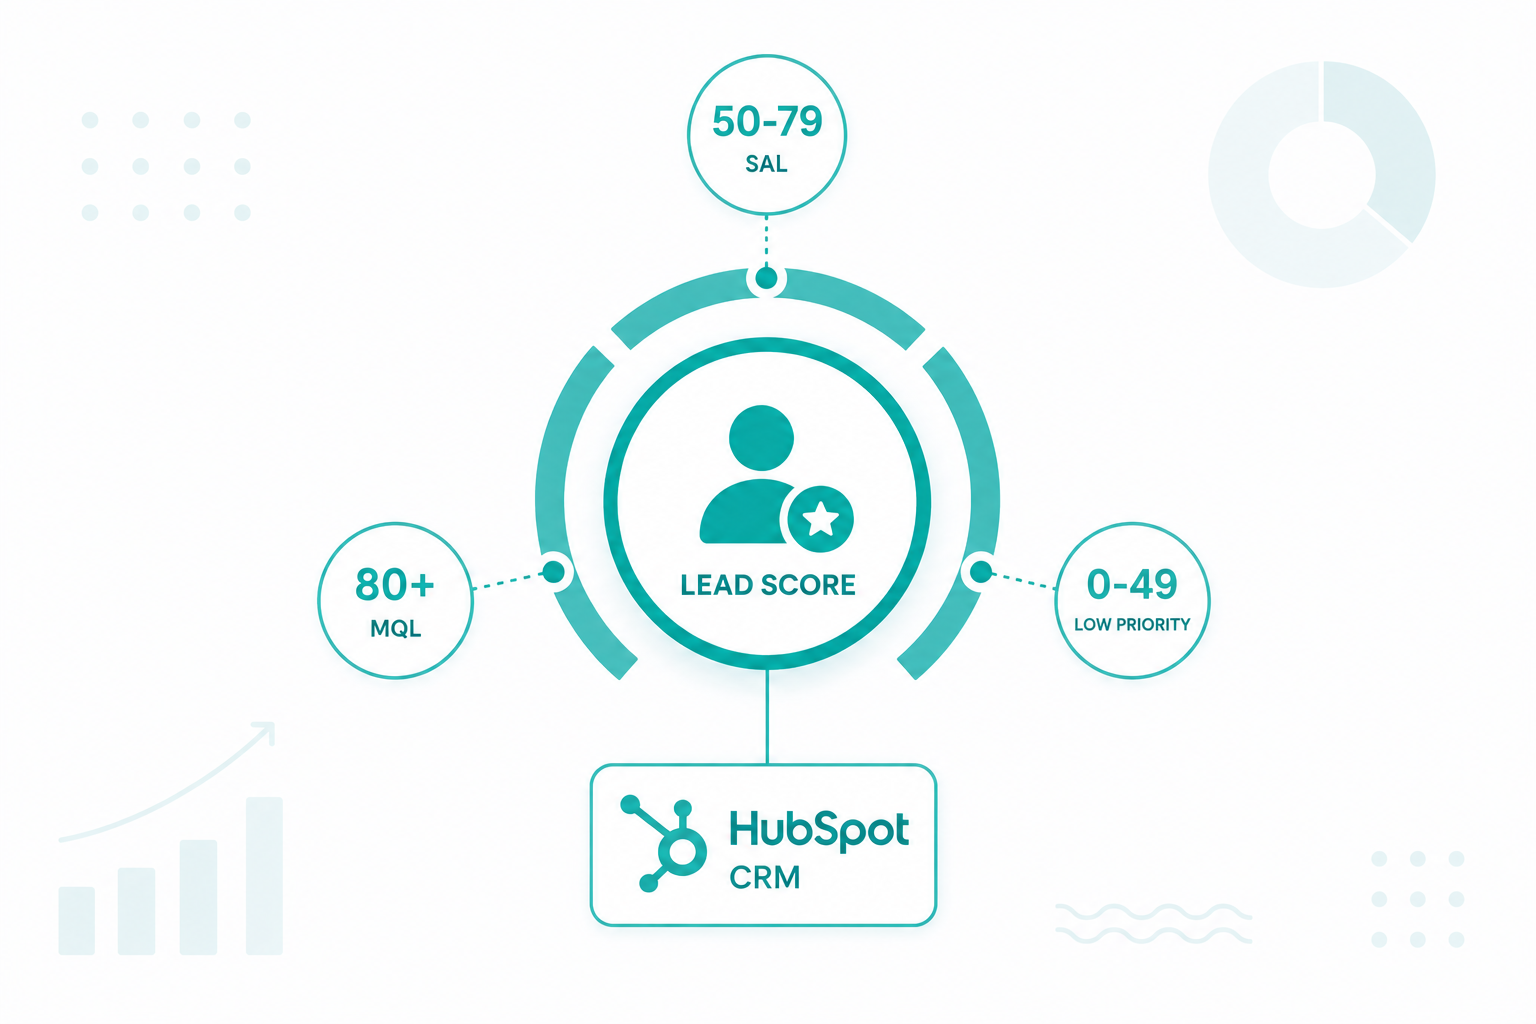
A RevOps-owned framework replaces that argument with a shared definition: which attributes indicate fit, which behaviors indicate interest, which actions indicate intent, what combination constitutes qualified, and what each team does at that point. Agreeing that 80 points equals an MQL is the easy part. Agreeing on what 80 points represents is the work.

Routing and Response Time

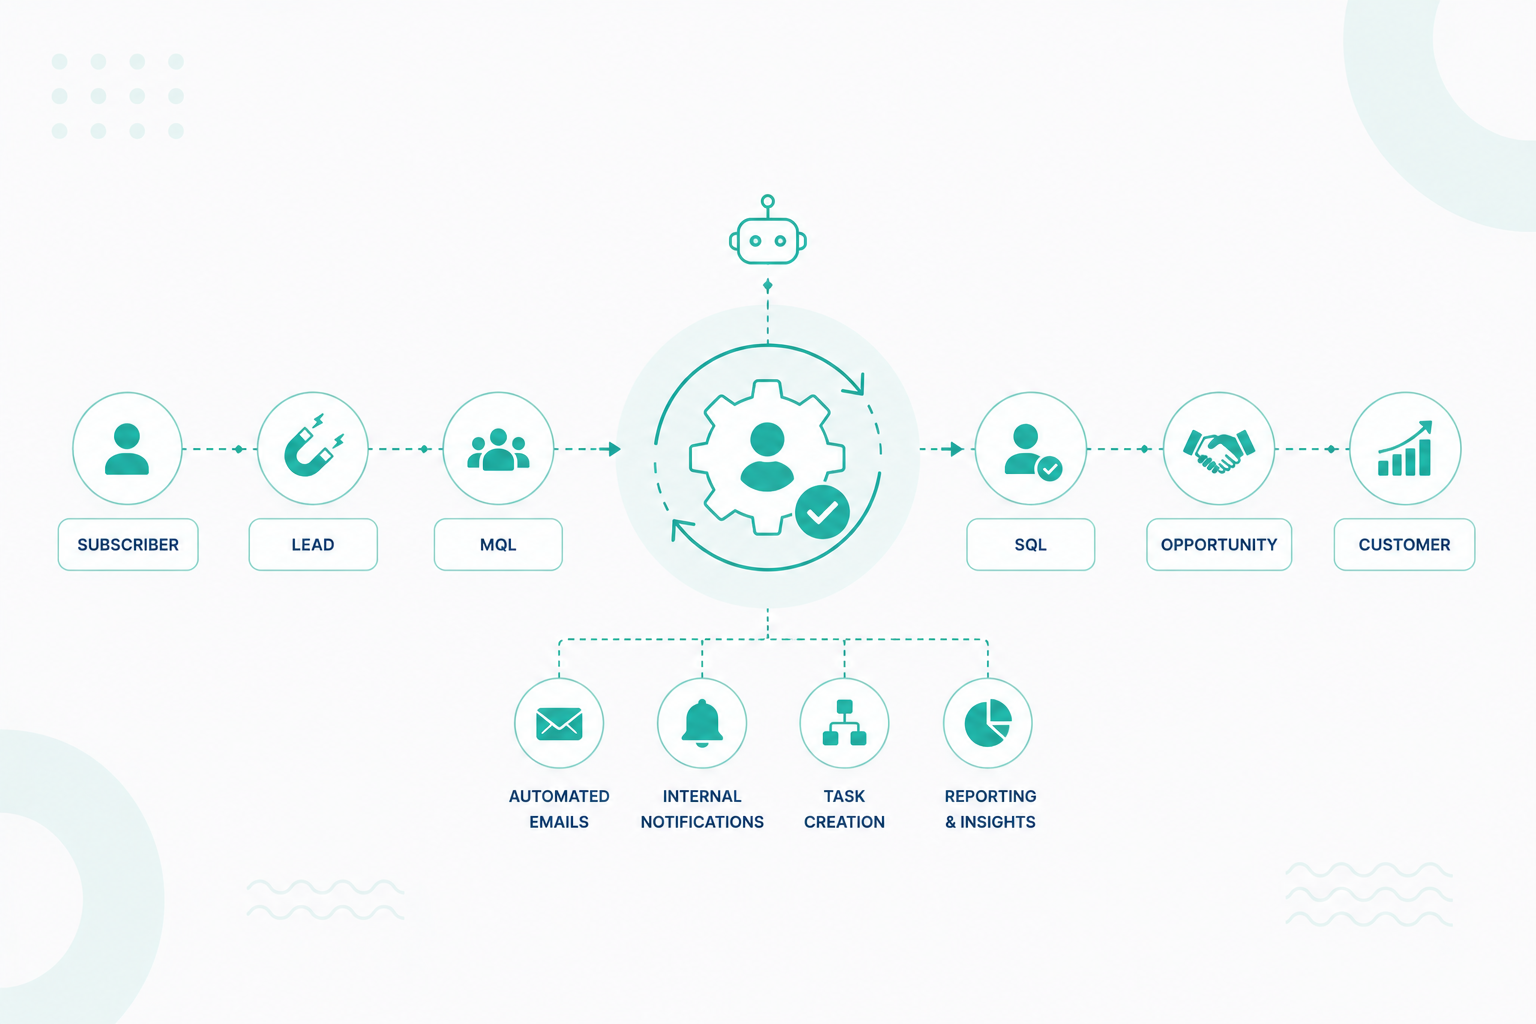
Threshold crossings should trigger real operational actions: owner assignment, task creation, internal notification, lifecycle stage update, segment membership, sales queue prioritization. HubSpot's distribution report even supports sending a threshold group directly into a new segment, workflow, or view.

Speed is where scoring pays off or leaks. A lead response management study found leads contacted within five minutes were roughly 21 times more likely to qualify than leads contacted at 30 minutes, and a 2026 benchmark across 939 B2B SaaS companies found only 23% of teams respond inside five minutes while 42% take longer than 24 hours, with close rates of 32% and 12% respectively. Accurate scoring that routes into a slow follow-up process still loses the deal.

Lifecycle Stage Kept Separate

A score measures fit and engagement. A lifecycle stage records position in your revenue process. Collapsing the two produces inconsistent data that breaks funnel reporting.

Use the score as one input to a stage change, alongside sales acceptance and other qualification criteria. HubSpot's lead automation can also progress lead stages based on sales activity such as outreach, replies, and meeting outcomes, which keeps stage data tied to what the team actually did.

Model Governance

At enterprise scale, a scoring model needs an owner and a change process. Document the model owner, the sales and marketing stakeholders, the purpose of each score, the approval path for criteria changes, the data quality standards, the reporting definitions, and the review cadence.

Without that structure, point values drift as individual teams tune for their own reporting, and nobody notices the routing consequences until pipeline dips. Governance turns edits into deliberate decisions.


How Do You Measure and Optimize the Model?

Measure the model by comparing score to outcome and not by counting how many high-scoring records it produces.

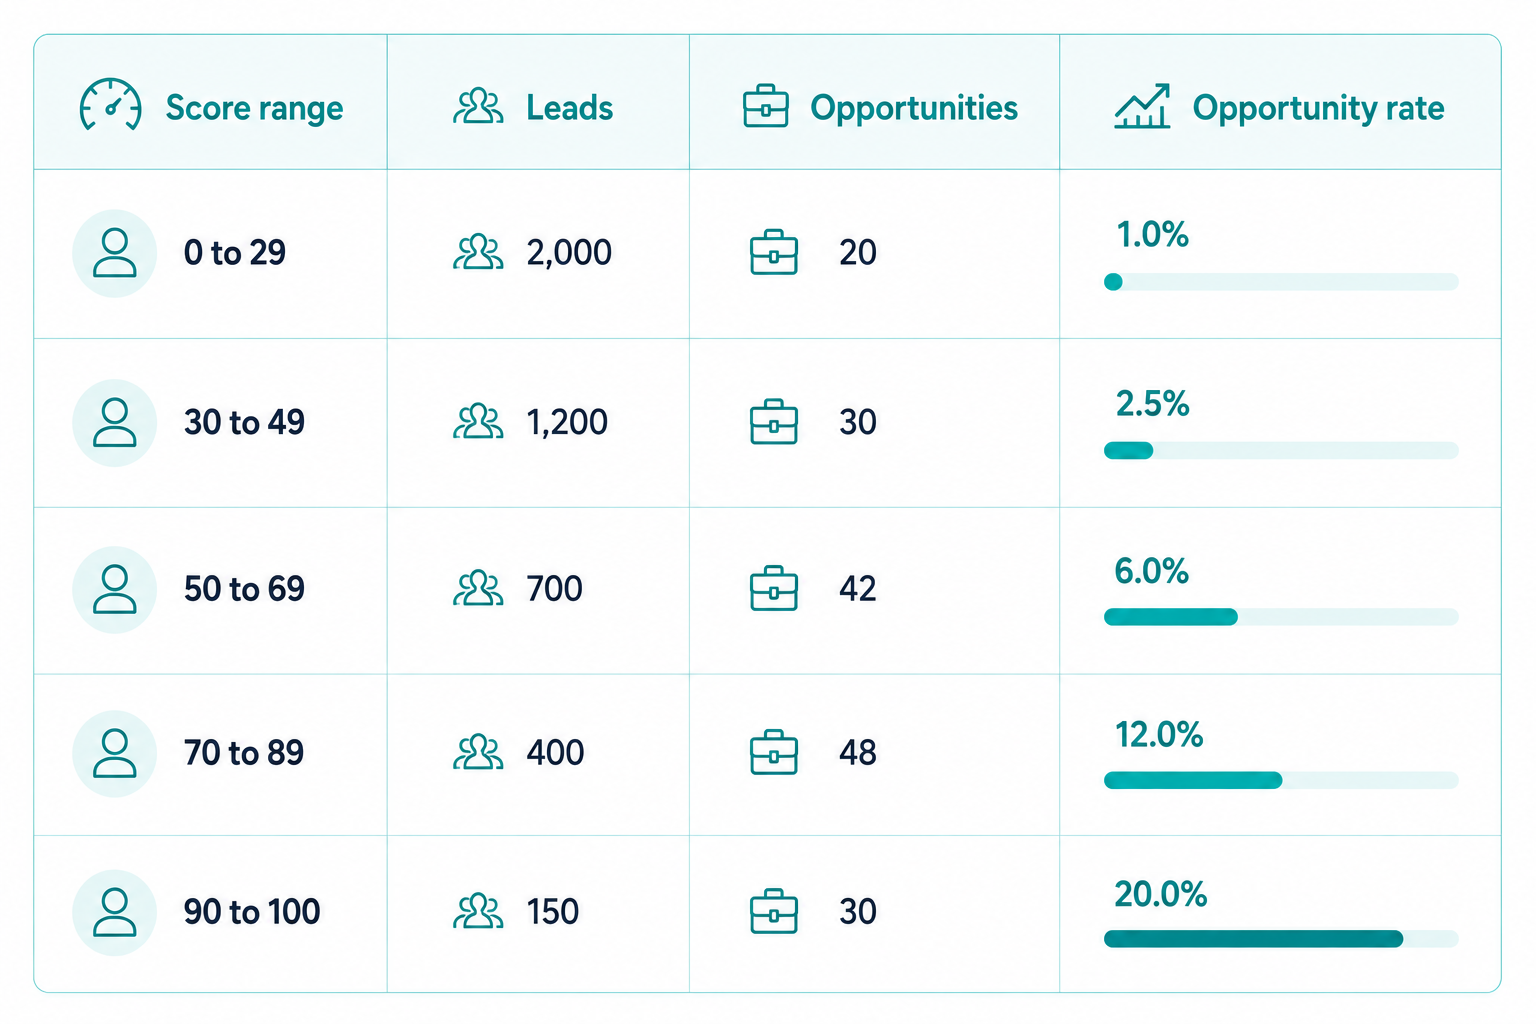
Conversion by Score Range

Segment records by score band and compare downstream conversion. The pattern matters more than the exact figures.

conversion-by-score-range

Useful companion metrics include MQL to SQL conversion, sales acceptance rate, opportunity to customer conversion, pipeline and revenue by score band, average deal size by score band, and first response time.

Distribution and Thresholds

HubSpot's performance view reports total records, records scored, and average, minimum, and maximum scores, then charts distribution across your threshold labels. Four patterns are worth watching:

  • Most of the database labelled High, which means criteria are too generous or the population is too broad
  • Almost nothing labelled High, which means the threshold is too restrictive for the volume sales can absorb
  • Similar conversion rates across every band, which means the model is not discriminating
  • Strong engagement paired with weak conversion, which means engagement criteria are rewarding activity with no commercial meaning

Threshold setting has an operational constraint as well as a statistical one. A threshold that is too low buries sales in marginal leads. Too high, and genuinely good prospects never reach a rep.

Fit Versus Engagement Diagnosis

Two records can both score 80 for opposite reasons. Because combined scores preserve fit and engagement as separate properties, you can diagnose which dimension is driving your distribution.

Look for low-fit contacts reaching high combined scores, high-fit accounts stuck at low engagement, and any band where one dimension is doing all the work. Each pattern points to a specific weighting fix.

Sales Acceptance

Revenue data is the verdict, and sales feedback is the early warning. Review a sample of high-scoring records with the reps who received them and ask if the accounts were in market, in territory, and relevant to their patch.

When the model says high priority and sales consistently says low priority, the gap is usually engagement outweighing fit. That is a criteria problem, not a rep adoption problem.

Record-Level Score History

Aggregate reporting shows what is happening. Record-level history shows why. The Lead Score card and index page score columns both open a panel with a six-month trend graph and the specific events that moved the number.

Use it on any record whose score looks suspicious. A score built from 40 page views tells a very different story from a score built from one demo request and a completed meeting.

A Quarterly Review Cycle

Set a cadence and stop waiting for complaints to force a review: monitor distribution and performance, analyze which signals correlate with conversion, validate against sales feedback and closed revenue, adjust criteria and thresholds, test against real records, deploy, then measure the change against the prior period.

Trigger an off-cycle review when the ICP shifts, a new market or product launches, sales qualification criteria change, conversion rates move materially, or a new high-intent signal appears in the data.


Where Does AI Fit Into HubSpot Lead Scoring?

AI in HubSpot lead scoring generates recommended criteria from your historical conversion patterns, then hands the model back to you for editing before activation.

What AI Scoring Requires

AI-built contact fit and engagement scores require Marketing Hub Enterprise and a minimum sample of 50 contacts, containing at least 25 converted and 25 non-converted records. You define the lifecycle transition to learn from, and HubSpot identifies commonalities among the contacts who made that transition. Setting Start as Marketing Qualified Lead, End as Sales Qualified Lead, and a 30-day timeframe produces criteria based on contacts who moved between those stages in the last month.

The same underlying approach powers high-impact web page insights, which is why both features get stronger as your conversion history grows.

What Stays With the Team

AI can surface patterns a manual build would miss, including signals nobody thought to test. It cannot decide which outcomes matter, which team a score serves, what threshold triggers a handoff, or how much fit should outweigh engagement in your market.

Historical correlation is also not automatically a qualification rule. A pattern that held while you sold one product into one region may not survive a new market entry. Treat AI-generated criteria as a strong first draft, then validate it against your ICP definition, sales feedback, and closed-won data before turning it on.

Build a Score Your Sales Team Will Act On

A lead scoring framework should be easy to explain. Sales should quickly see whether a high score comes from strong ICP fit, recent high-intent activity, engaged stakeholders, or a combination of these signals.

A strong framework starts with a clear decision, targets the right audience, separates fit from engagement, prioritizes high-impact signals, limits noise, applies score decay, connects thresholds to actions, and validates results against pipeline. HubSpot supports these steps with features such as association aggregation, group limits, and distribution previews.

If your team cannot explain why a record has its score, the framework needs review. Campaign Creators builds and audits enterprise HubSpot scoring frameworks around this standard.

Frequently Asked Questions

What Is the Difference Between a Lead Score and a Lead Scoring Framework?

A lead score is the calculated value on a record, and a framework is the surrounding system that defines which signals earn points, which records get scored, what each threshold triggers, and which revenue metric validates the model.

How Many Lead Scores Can You Create in HubSpot?

The number and type depend on your subscription tier, so treat each score as a finite slot that has to earn its place with a specific purpose, audience, and downstream action.

What Score Should Trigger a Handoff to Sales?

Set the threshold from your own conversion data by finding the band where conversion rate climbs meaningfully, then confirm the resulting lead volume matches what your sales team can work within its response time target.

Does HubSpot Lead Scoring Work for Account-Based Sales?

Yes, because company scores aggregate associated contact activity using Sum, Average, Min, or Max, which surfaces accounts where several stakeholders are each engaging at moderate levels.

Can AI Build a Lead Score in HubSpot?

Yes, for contact fit and engagement scores on Marketing Hub Enterprise, which needs a minimum of 50 contacts, including 25 converted and 25 non-converted, and returns editable criteria you should validate against your ICP and sales feedback before activation.