 Campaign Creators
When to Use a Drip Campaign vs Nurture Campaign
As every statistics-scouring marketer knows, email is alive and thriving. Offering an average ROI of $38 for every dollar spent and seen as the most...

Nothing matches the feeling you get when you launch a social media campaign and the likes, comments and retweets are flying in. Wouldn't it would be nice if every campaign went just like that?
At other times you launch a campaign only to see the occasional like or retweet, but it's hard to know if this is a total failure or just in need of some tweaks. So what do you do? You dig into the numbers. When running any campaign it is imperative to track metrics regarding your KPI's from the very start of the campaign and compare these to your benchmarks. Ideally your company has its own benchmark based on historical data to compare to. But it is also important to look at industry statistics to see how you are stacking up to your competitors.
If you aren't sure what social media metrics you should be tracking or if your campaign is doing well, here's what we're talking about...
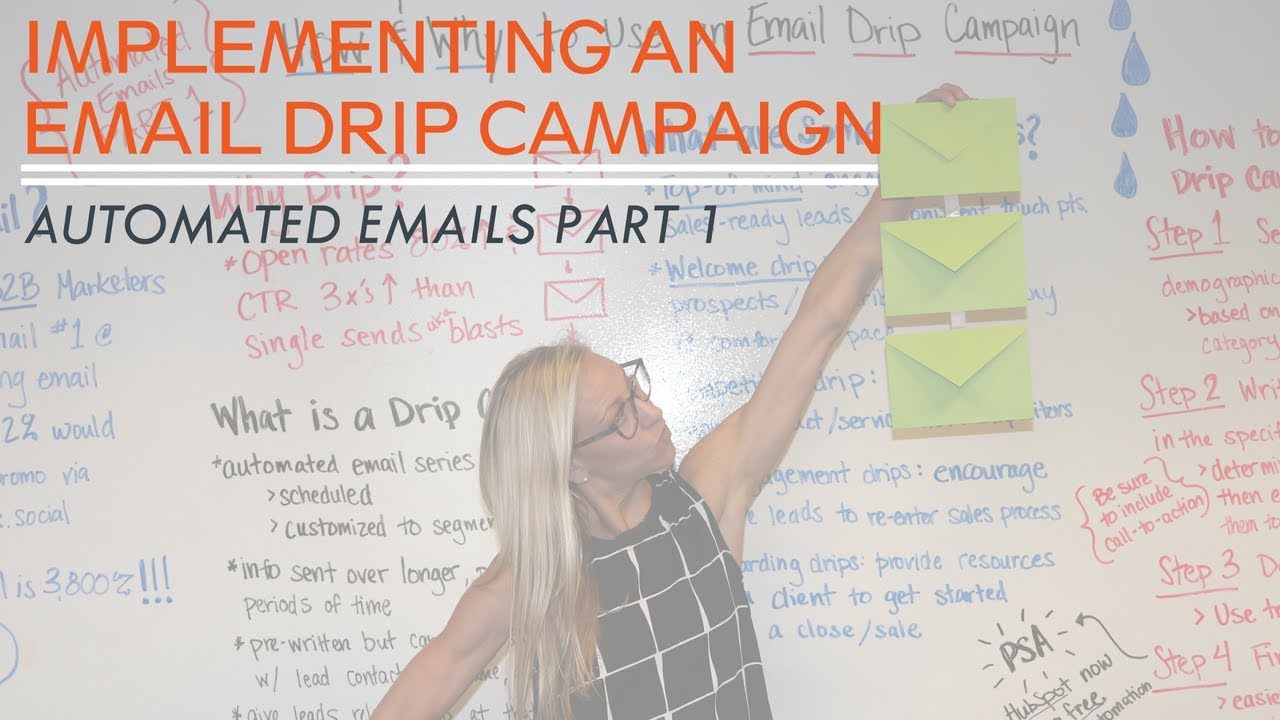
This blog post is part of “Your Definitive Guide to Lead Generation” blog series.
“Most marketers’ report that proving ROI is their biggest challenge.”
This article talks about the event paid metrics you should be tracking: the bid, CPM: Cost-Per-Thousand Impression, CPC: Cost-Per-Click, Audience Growth Rate, Potential Reach, Click-through-rate (CTR) and conversion.
“Benchmarking is a way of looking at your stats, side-by-side with a meaningful standard."
This article covers everything you need to know regarding social media benchmarking from which stats to track to what the stats should look like. The article also covers the four types of benchmarking: aspirational, trended, earned, inspirational. And for getting started on social media strategy in general, check out 5 Tips for Getting Started with Social Media 101.
“Right when you think you’re getting a grasp on your demographics, buyer habits and trends on social media, something new changes and turns your data into old news.”
This article breaks down the 47 essential statistics across each social media platform: Instagram, Facebook, Twitter, LinkedIn, SM Advertising, and SM Engagement.
Wondering which of these platforms is best to target for the video component of your social media strategy specifically? This article might give you some insight.
“If you have 100 Twitter followers or more, you are among the top 7% of Twitter users as measured by number of followers.”
This article covers some interesting statistics regarding how you measure up against your peers and could help guide you on where to focus your strategy.
“So in addition to determining your buyer personas, you have to know where to find them.”
This infographic covers where people are located on social media and the demographics of who is active on each platform.
Once you have your benchmarks and own campaign stats, how do you know how well your numbers compare? In this video learn how to determine whether or not your social media campaign numbers need improvement so you can prioritize your optimization activities.
Aside from social media, other areas of your marketing strategy also require solid metrics to be not only maintained, but improved continuously. Your Essential Marketing Metrics is a free inforgraphic that will get you on your way! Click here to download.

What metrics do you think are important in determining the success of your social media campaign? Comment below.
As every statistics-scouring marketer knows, email is alive and thriving. Offering an average ROI of $38 for every dollar spent and seen as the most...

No successful crowdfunding campaign planner “just wings it.” For a product to be funded, it needs passionate support and trust from consumers. A...

It's Christmas eve morning! So much excitement surrounds this cherished holiday. It's the time of year when people fully appreciate even the smallest...