
.png?width=170&height=170&name=Round%20Blog%20Thumbnail%20(51).png)
CRO Marketing Metrics: What to Track & Why
Conversion Rate Optimization (CRO) marketing is vital to any successful digital marketing strategy. Why? Because driving traffic is no longer...
Free assessments, knowledge, and expert content for your HubSpot.
Driving traffic is only half the job in conversion rate optimization (CRO). Conversions often get treated as the end goal, but real progress comes from understanding the data that links user behavior to revenue. CRO metrics and KPIs give you that visibility, showing which parts of your campaigns are working and which are not.
When you don’t track the right indicators, your optimization efforts turn into guesswork, leading to missed opportunities and wasted resources. Once you monitor the full customer journey through these 12 key metrics, you can spot friction points more clearly and make meaningful decisions based on data.

Metrics and key performance indicators (KPIs) are the measurable data points used to track user behavior and determine the success of digital experiences. While often used interchangeably, they serve distinct purposes in a business strategy.
A common saying in data analysis is that all KPIs are metrics, but not all metrics are KPIs.
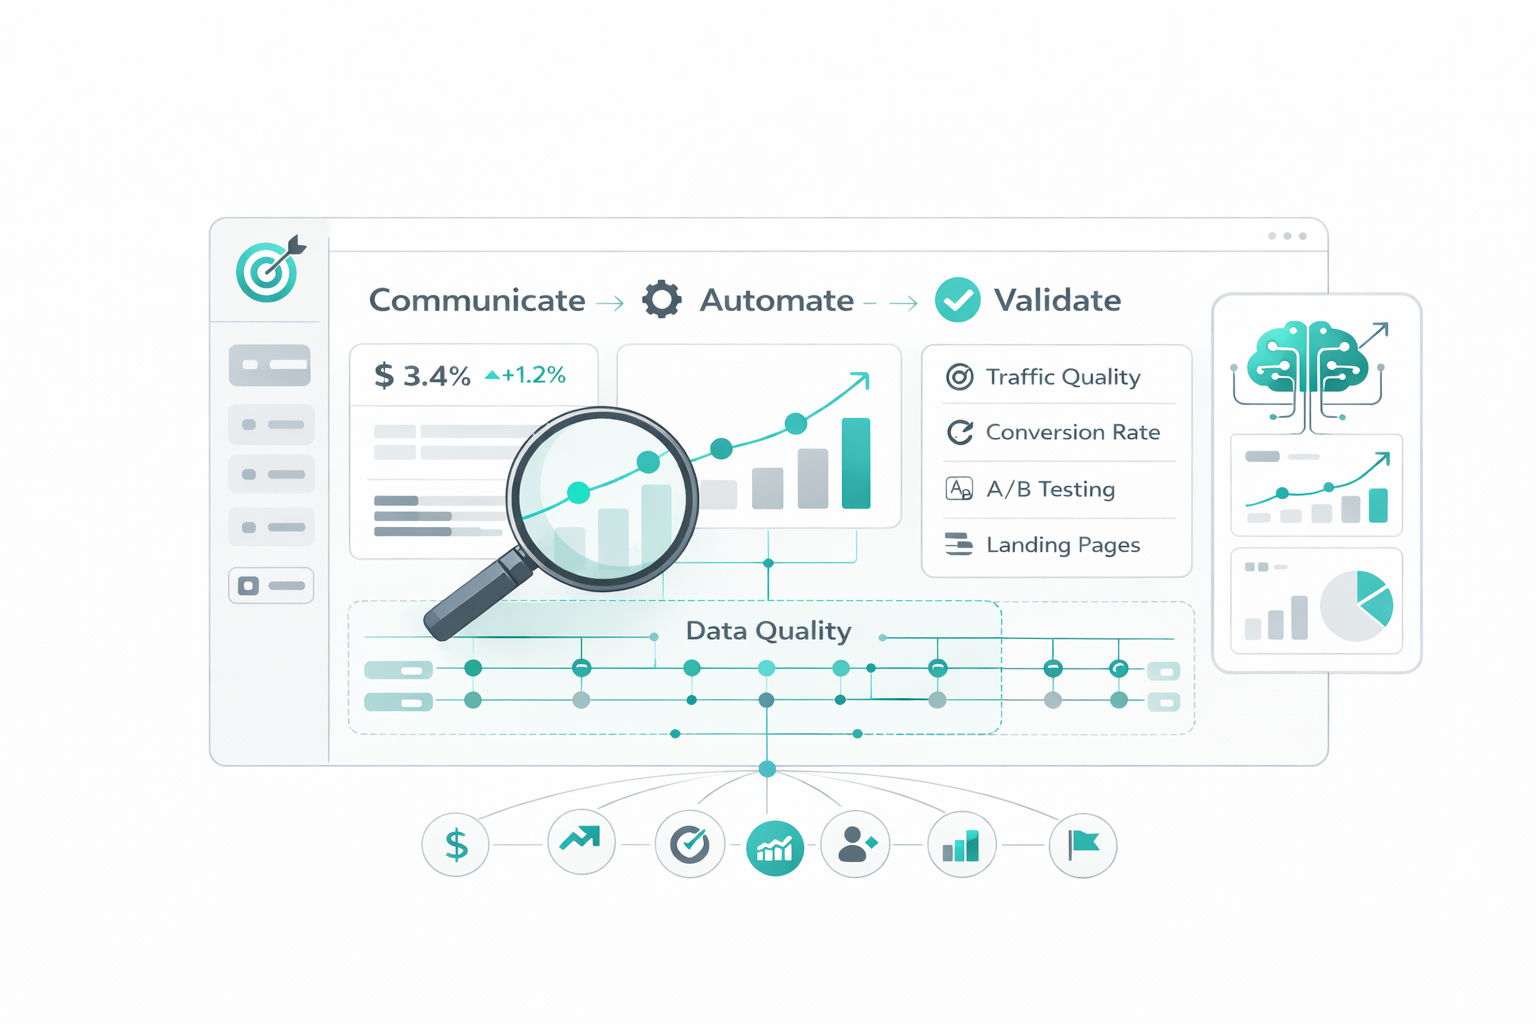
CRO metrics and KPIs provide a lens through which you can view the entire conversion journey, from the first interaction to long-term customer retention. These indicators are generally categorized into three areas: engagement metrics (how users interact), conversion metrics (how effectively goals are achieved), and user experience (UX) metrics (how intuitive the site feels).
CRO metrics are essential as it provides visibility into the "levers" you need to pull to increase growth. Without these data points, optimization efforts operate in the dark, leading to wasted marketing dollars and missed opportunities. Data serves as a diagnostic tool to uncover bottlenecks in your marketing funnel. For instance, a high bounce rate on a landing page might signal that the content is irrelevant to the ad copy or that page load times are too slow.
Furthermore, metrics enable marketers to allocate resources to high-performing strategies rather than pouring money into ineffective channels. By responding to data, businesses can create personalized experiences that boost customer satisfaction and loyalty. This focus on data-driven analysis ensures that existing traffic is leveraged effectively, which results in a higher return on investment.
This metric represents the percentage of website visitors who complete a specific goal, such as purchasing a product or filling out a lead form. It acts as a vital snapshot of a landing page's effectiveness, showing how efficiently a site transforms visitors into customers.
To improve this rate, businesses often use A/B testing to evaluate elements like headlines, images, and buttons to identify which versions drive the most action. A low conversion rate often signals issues with usability, a lack of trust signals, or a mismatch between what an advertisement promised and what the page actually delivers.

CTR measures the frequency with which people engage with a link, button, or advertisement after seeing it. It serves as a direct indicator of whether your messaging and design resonate with the specific needs and interests of your target audience.
Higher rates suggest that your content is successfully motivating users to take the next step in their journey. Conversely, low engagement often highlights the need for clearer calls to action (CTAs) or more personalised ad copy that directly speaks to the user's pain points.

This tracks the percentage of visitors who leave your site after viewing only the entry page without performing any further action. In many cases, a high bounce rate suggests that the landing page fails to meet user expectations or suffers from slow loading speeds and poor mobile responsiveness.
By analyzing this metric, marketers can identify underperforming entry points and test adjustments to design or copy to retain more visitors. Reducing media file sizes and ensuring the content is relevant to the traffic source are common tactics to keep users from departing prematurely.

Exit rate monitors the percentage of visitors who leave the site from a specific page after having viewed it. Unlike bounce rate, which focuses on single-page sessions, the exit rate helps identify bottlenecks on critical pages deeper in the funnel, such as product descriptions or the checkout process.
High exit rates on these pages can signify technical frustrations or navigation problems that hinder the completion of a goal. Measuring these rates enables practitioners to test targeted changes, such as simplifying the path to purchase, to ensure visitors stay on the conversion path.

AOV tracks the average dollar amount spent every time a customer places an order. It is a strategic indicator used to evaluate the success of upselling and cross-selling efforts, such as offering relevant product recommendations during the shopping experience.
For e-commerce businesses, increasing this value is a powerful lever for revenue growth because it maximizes the return from existing customers. Monitoring AOV helps teams understand which marketing segments or product categories are driving the most financial value.

This calculates the total marketing spend divided by the number of leads or customers gained. CPA provides visibility into the financial efficiency of marketing campaigns, ensuring that the investment required to gain a new customer is sustainable for the business.
High costs in this area can indicate inefficiencies within the sales funnel or wasted budget on traffic sources that do not convert. By refining targeting and improving landing page quality, businesses can lower their CPA and reallocate resources to higher-performing channels.

CLV measures the total revenue a business can expect from a single customer throughout their entire relationship with the company. This high-level indicator helps companies balance their acquisition costs and prioritize resources for the most profitable audience segments.
Understanding this value guides long-term strategy, such as implementing loyalty programs that encourage repeat business or improving customer service to extend the average customer lifespan. A strong CLV indicates a healthy relationship between the brand and its advocates.

This metric reveals the percentage of shoppers who add items to their online cart but leave the website without completing the transaction. High abandonment rates often point to friction in the checkout process, such as unexpected shipping costs, complex forms, or a non-intuitive user interface.
Tracking clicks on the "Add to Cart" button provides diagnostic power, identifying exactly where in the purchase funnel users are losing interest. Streamlining the final steps and using reminder emails are effective strategies to recover these potential sales and improve the overall conversion process.

Loading speed is a technical performance metric that measures how quickly content displays to a user. Research indicates that 53% of mobile visitors will leave a page that does not load within three seconds, making speed a primary factor for user retention.
Slow load times damage your reputation and lead to a measurable drop in conversion rates. Prioritizing the optimization of media files and code ensures that visitors do not leave before they even see your primary messaging.
RPV calculates the average revenue generated by each person who visits the site, tying traffic quality directly to profitability. This metric provides a clear picture of audience value in monetary terms and is essential for assessing the outcome of CRO efforts.
Optimizing RPV involves a combination of driving qualified traffic and increasing both conversion rates and order values. It helps businesses see if their design changes are resulting in actual financial gains rather than just increased engagement.

ROAS evaluates the revenue generated for every dollar spent on specific advertising campaigns. This is a crucial metric for evaluating marketing effectiveness and identifying the most successful strategies for budget allocation.
A high ROAS indicates that your ad campaigns are driving substantial revenue relative to their costs. Teams can improve this score by continuously A/B testing different ad elements and using message matching to ensure a smooth transition from an ad to a landing page.

Scroll depth measures how far down a webpage a visitor travels, providing insight into user engagement with long-form content. It reveals whether users are reaching primary CTAs or if critical information is buried too low on the page to be noticed.
This data helps businesses reposition elements to capture interest before a user loses focus and leaves the site. By adjusting the layout based on these findings, you can ensure that important value propositions are seen by users who do not scroll to the bottom.

The basic formula for measuring conversion is straightforward:
Conversion Rate = (Number of Conversions / Total Number of Visitors) x 100.
For example, if a landing page has 5,000 visitors and 150 fill out a form, the rate is 3.0%. While the math is simple, the meaning of the result depends on how you define two variables:
The Numerator (Conversions): You must define what counts as a "desired action" consistently. This could be a purchase, a trial signup, or an email subscription.
The Denominator (Visitors): You can use total sessions (every visit) or unique visitors (deduplicated individuals). Unique visitor counts are often more meaningful as they represent the percentage of people who become customers rather than just page-load frequency.
Building a structured measurement framework is the foundation of any successful optimization strategy. This ensures your team makes meaningful data-driven decisions.
Using the SMARTER method (Specific, Measurable, Attainable, Relevant, Time-bound, Evaluate, and Reevaluate) or the Six A’s (Aligned, Attainable, Acute, Accurate, Actionable, and Alive) helps validate that your indicators are meaningful.
Focusing on 2–5 critical KPIs per business goal prevents your team from feeling overwhelmed by irrelevant data.
You must create benchmarks based on your current website's performance. This involves using funnels and goal-tracking to determine your baseline, the starting point from which all future uplift is calculated. By identifying where the site stands today, you can more easily spot conversion leaks and prioritize areas for improvement.
A robust framework distinguishes between macro conversions (primary outcomes such as revenue or trial signups) and micro conversions (incremental steps such as cart additions or form starts).
While macro conversions reflect overall business health, tracking micro conversions provides diagnostic power, identifying exactly where in the journey visitors disengage. This granular view makes it easier to pinpoint friction points that hinder the final goal.
Organize your metrics around a recognized model to capture the entire customer lifecycle. Popular frameworks include:
Avoid viewing all traffic through a single lens, as aggregate data often hides actionable insights. Your framework should segment data by traffic source, device type, and new versus returning visitors to reveal patterns specific to different audience groups.
Additionally, target "quick wins", low-hanging opportunities like simplifying a form or improving mobile load speed, to deliver immediate results while building long-term optimization gains.
The final step is to establish a consistent schedule for reviewing performance indicators. Operational metrics like bounce rates and click-through rates can be monitored on a short-term or real-time basis, whereas strategic KPIs are better analyzed over a month, quarter, or year. Regularly reevaluating your framework ensures that the metrics you track remain aligned with evolving business strategies and user behavior.
Beyond these metrics, you can also explore this guide on 6 Top Lead Nurturing Conversion Optimization Strategy Tips to see how they come together in real scenarios and support better conversion outcomes.

A major roadblock in many programs is testing without a roadmap. It leads to unorganized experiments and unreliable results. Another frequent error is testing with an inadequate sample size, which prevents the data from reaching statistical significance.
Other common mistakes include:
That’s exactly why following a structured framework like the one outlined above changes how your results play out. When everything follows a defined structure, you move from isolated tests to a system that continuously learns, compounds insights, and improves performance over time.
High-performing businesses treat conversion optimization as an ongoing discipline, not a one-time effort. These metrics act as a diagnostic lens, helping you uncover hidden friction points across the user journey that guesswork often misses.
Long-term growth comes from a shift in mindset. Experiments that don’t win still give you direction, helping you build a stronger baseline for future improvements. With a structured measurement framework in place, each test connects to a larger system, turning scattered efforts into consistent progress.
If you want a clearer way to connect your metrics, experiments, and outcomes, our CRO services can help you build and apply a framework that brings everything together. Reach out to see where your conversions may be falling short.


Conversion Rate Optimization (CRO) marketing is vital to any successful digital marketing strategy. Why? Because driving traffic is no longer...
Marketing conversion has become more important as digital competition increases and customer attention spans continue to shrink. Research shows the...
Producing online traffic via social media, SEO, and even paid search is a great start for a marketing strategy, but certainly not a guarantee that...