7 Highly Effective Strategies to Increase Your eCommerce Customer Lifetime Value (CLTV)
For every eCommerce business, there are important eCommerce marketing KPIs to track: number of orders, revenue, profits, etc. However, there’s one...
In this video blog, Sean shows you how to calculate the sample size you need for your A/B test using this free online calculator from Optimizely.
This blog post is part of “Your Definitive Guide to Lead Generation” blog series.
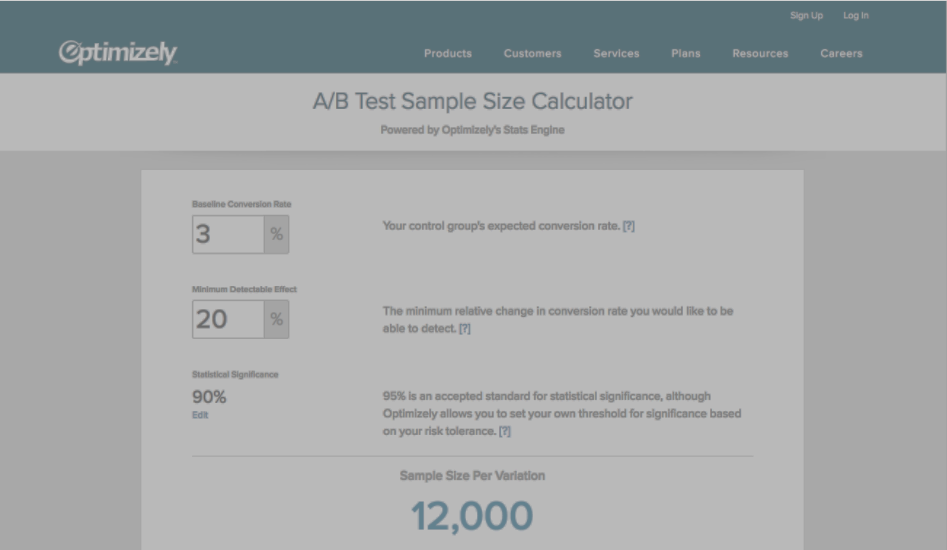
All right, so this Hack #5, this is an interesting one. Another very common question I get from people, and that's the sample size calculator. So a lot of agencies, a lot of consultants use this. It's simply called Optimizely. You can see the URL here, just on top, it should be resources/samplesizecalculators. Thanks, Optimizely, for giving us this great tool. There's three very simple variables. There's always a question, "How do I determine what my sample size should be in order to get a statistically significant result?" That's a very common question, kind of Stats 101. They gave us this great tool here to be able to utilize.
So first you have to determine your baseline conversion rate. So say you're talking about a landing page and your landing page is currently converting at 10%. So that's the control group. You can also use, say, industry averages for your control group, if you're not testing based on historical data. Historical data is always better than industry benchmarks just because when it comes to your company and your message and your marketing, it's going to be different for everybody. If at all possible, use your control group and use that historical data as that control group if at all possible.
Minimum detectable effect, this is kind of simple in an idea, but it actually gets a little bit more complex. That basically talks about the minimum relative change in conversion rate. So, how much of that conversion rate change do you want to be able to detect, and we know that as this number goes down, once we start getting down to 19, 18, 17, and so on, all the way to say, 10%, sample size variation goes up dramatically. Depending on how much of that conversion rate you want to be able to tell when it changes, the minimum detectable effect, and they have some great tools to read more if you'd like to read more on that. But the sample size will go up as a result.
Finally, statistical significance, this is probably something a lot of us remember from Stats. A lot of people do use that 95% as that benchmark. So yeah, I like to use that 95%. I think that's a great starting point, and you can always again adjust as well with this cool little slider that they have. So yeah, this is a really great tool, really great answer to the question, "How do I know if my sample size is big enough?" "How do I know if I have a statistically significant result?"
Are you currently running any A/B tests on your landing pages or website? Tell us about it below. And check out the 6th hack in our series, where we go over removing jargon from your blog to make it more audience-friendly.
Interested in learning how to enhance your inbound strategy? Download this free Inbound Marketing Ecosystem worksheet to create the assets necessary to start generating and converting your leads like never before.


For every eCommerce business, there are important eCommerce marketing KPIs to track: number of orders, revenue, profits, etc. However, there’s one...
You just acquired a new customer. Congratulations! Let's pop a bottle and celebrate. Not so fast. Acquiring new customers is great, but making...
If you find yourself wondering: “What’s a good conversion rate for my eCommerce store?” then heads up: You’re asking the wrong question.