
.png?width=170&height=170&name=Round%20Blog%20Thumbnail%20(51).png)
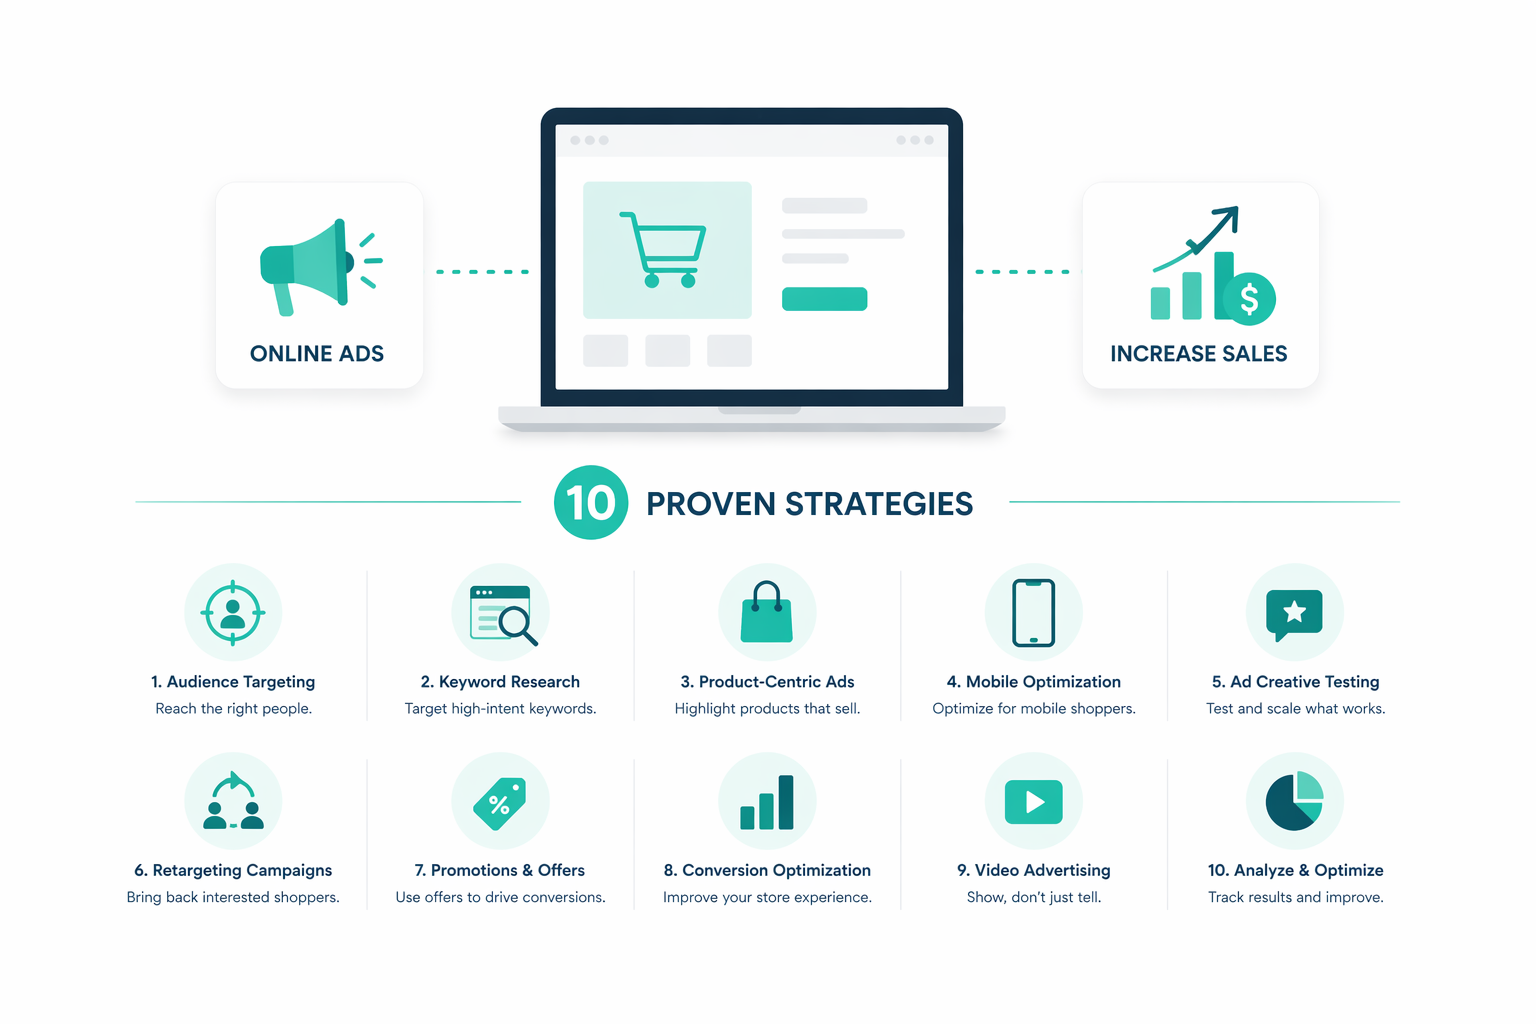
Ecommerce Online Ads: 10 Proven Strategies to Increase Sales
E-commerce continues to scale at a rapid pace, with global online revenue projected to reach $6.88 trillion. That growth creates more opportunity,...
Free assessments, knowledge, and expert content for your HubSpot.

An actionable conversion rate optimization strategy starts with gaining insight into the hearts and minds of your past, present, and future customers. The best way to accomplish that is through cold, hard data.
But what kind of data is relevant for CRO, and how can it be systematically and efficiently collected? We’ll be exploring that question today, starting with making the distinction between two main varieties of data: quantitative and qualitative.
For those who prefer to watch rather than read. Here is Part 1, Part 2 is a little below...
Quantitative data, simply put, is characterized by quantities-- structured, often numerical criteria that can be analyzed with statistical methods. This type of data focuses on the “what,” “when,” and “how” of customer and lead behavior and is often collected through research methods like surveys and experiments, to which a set of procedures can be applied systematically.
The two main types of quantitative variables are continuous and discrete. Continuous variables can take any value (including decimals) over a range, and are measured in units like hours and seconds, fractions of a dollar, and percentage rates. On the other hand, discrete variables are generally counts of things that can only take a whole value, like referrals, site views, and new customers, or rating scales in surveys.
Some examples of potential insights provided by quantitative research include:
Heat maps are visual representations of data that provide information on how site visitors interact with specific page and elements on your website. A color or monochrome gradient is used to distinguish areas of higher activity. Examples of variations on heat maps include hover maps, scroll maps, mouse movement maps, attention maps, and more.
Click maps, similarly, demonstrate which page elements are attracting the most attention and are actually being clicked on, such as CTA buttons, links, and interactive features. Outside of analytics that track metrics like click-through rates, click analysis can help to identify which site elements are being visually perceived by viewers as clickable and click-worthy.
KPIs, or key performance indicators (as we discussed in a previous article), tend to be best suited for quantitative data research. They are also in a sense the most straightforward way to collect this type of data, as they can be tracked and statistically analyzed directly-- with the help of the right software, of course.
Google Analytics comes most easily to mind for marketers, but there is a large variety of other tools out there for data collection and compilation, suited to every budget and company type. From Crazy Egg to KissMetrics to Woopra, the range of features and options available can be overwhelming. Take the time to conduct the research necessary to choose the option that fits your company best.
In the case of quantitative data, it is important to create surveys with the right variables in mind, most often discrete. The nature of the questions in the survey, and the answer choices available, should reflect this.
Consider examples such as:
Also known as split testing, A/B testing allows you to test variations of some element of a campaign, like a landing page, alongside one another. The results will enable you to determine which version is the most effective option. A/B testing begins with creating two (or more) versions of a piece of content, which are then presented to similarly sized audiences.
The responsiveness and conversion rates of the test groups are recorded and analyzed with CRO testing and/or analytics software. Many of the platforms that support tracking and analysis of the KPIs mentioned earlier also support these tests. Because it is practically a staple of a CRO strategy, A/B is a necessary feature to look out for when choosing the right tools for improving your conversion rate.
Watch part 2...
Qualitative data is more unstructured information that is intended to be analyzed subjectively. Unlike quantitative research, qualitative research is exploratory and focuses on the “why,” aiming to gain insight about a particular topic. It can also help answer questions about the results of quantitative research, providing explanations and illustrations that bring clarity and direction to your next business move.
This data is commonly collected through focus groups, surveys, and observation. (Note that surveys can be applied to both quantitative and qualitative data, depending on the questions asked and how the results are analyzed.)
Two of the most popular methods for gathering qualitative data are interviews, which allow for direct communication with customers about where CRO strategy may be lacking, and customer surveys, which gather feedback on a larger scale. Examples of insights which qualitative data can provide include:
Open-ended surveys involve asking open-ended questions, which means minimizing multiple-choice options and instead requesting descriptive, essay format responses. As the goals for qualitative surveys are broader, and the results more ambiguous in terms of interpretation, it can seem difficult to determine what type of questions to include.
Fortunately, there are several universally applicable key topics to cover, in addition to more specific questions that may be relevant to your company’s industry/products/services. These include:
The last point is particularly crucial, as much of CRO revolves around viewing and understanding customers as individuals with histories, fears, desires, goals, etc. By accumulating this information, you will be able to develop effective customer personas over time.
Interviews are one of the most flexible ways to gather data, while additionally gaining trust and strengthening a relationship with the respondents. By making the process more “human,” it may be easier to receive more authentic and insightful responses. In addition, in person conversations can yield information indirectly through the interviewees’ tone of voice and body language.
It’s also possible to put an existing feedback system-- customer help chats and phone conversations-- to use. If your software keeps accessible logs of these, they can prove to be a small goldmine of insight into common complaints, usability of site features, areas of highest satisfaction, and more.
User testing gives you live input on how prospects use your website by recruiting a group of random users to perform certain tasks on your site and identify common issues. Tests can be performed in person or remotely, but are recorded for analysis in either case.
User testing begins with creating test protocols, or tasks, that users will be completing. The overarching goal is to assess the key actions most necessary for conversion to occur, such as sign-ups, checkouts, landing pages, etc. Even broader objectives can be broken down into a series of tasks, and fleshing out good personas will yield probable scenarios for you to simulate in testing.
Last but not least, another example of the potential of recycled content in data collection is the use of existing customer reviews and secondary channels that allow for client feedback. These include blog pages, social media platforms, and forums.
If you have been observing a consistently low turnout of comments and reviews, consider incentivizing customers with something like a rewards point scheme, or at least simplifying the response process. While it will not always fit neatly into your objectives for the kind of data you consider most valuable to collect, customer feedback will send the message loud and clear about the best and worst components of their experiences with the company.
Understanding how and when to apply the two types of data is a major step in developing smart data collection within a CRO strategy. Quantitative data is most useful for identifying concrete facts and figures, such as the pages on your site with the highest bounce rates.
When it comes to specific site elements or a simple set of variations, such as the kind that would be used in an A/B test, quantitative results are the way to go. Anything that can be analyzed with analytical software effectively should be classified as quantitative data, as well.
Qualitative data, on the other hand, provides the greatest advantage in determining the motivation behind prospects’ behavior. It adds a crucial psychological component to CRO-- which is where feedback sources, like surveys and polls, prove their worth in providing a glimpse into respondents’ minds. As mentioned previously, applying it to quantitative research results can yield a deeper understanding of the actions that should be taken next.
Want to optimize your campaign? Start by optimizing your lead generation efforts with your free Lead Generation Campaign Optimization Handbook. Use this handbook to boost your marketing efforts and take your metrics to a new level.

E-commerce continues to scale at a rapid pace, with global online revenue projected to reach $6.88 trillion. That growth creates more opportunity,...

The New Frontier of Lead Generation

In today's digital age, attracting website visitors is just the tip of the iceberg; the real challenge lies in converting those visitors into...